## 3D Surface Plot: True ∞ - FE vs. x'1 and x'2
### Overview
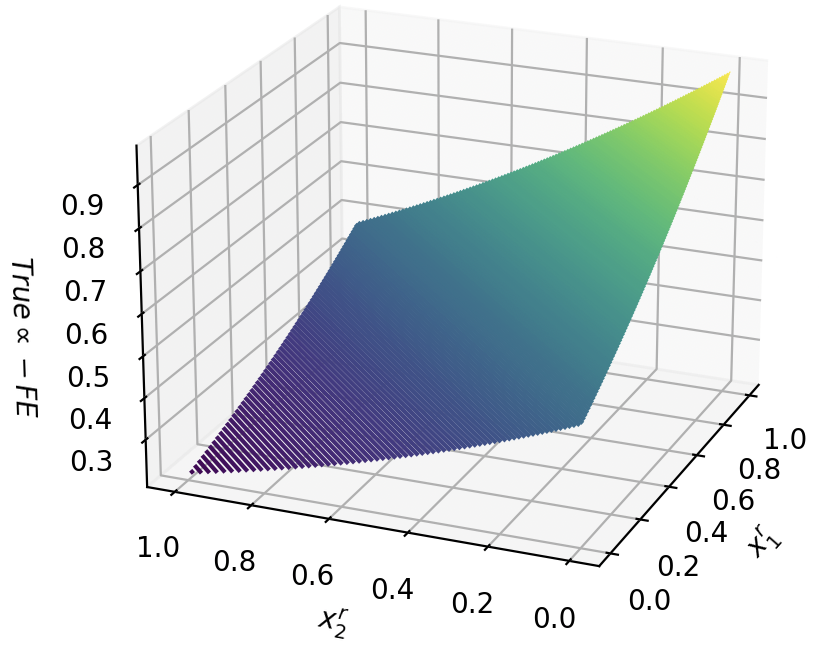
The image is a 3D surface plot visualizing the relationship between two variables, x'1 and x'2, and a third variable represented as "True ∞ - FE". The surface shows how the value of "True ∞ - FE" changes as x'1 and x'2 vary from 0 to 1. The color of the surface varies from dark blue/purple to yellow, indicating the magnitude of "True ∞ - FE".
### Components/Axes
* **X-axis (x'1):** Ranges from 0.0 to 1.0 in increments of 0.2.
* **Y-axis (x'2):** Ranges from 0.0 to 1.0 in increments of 0.2.
* **Z-axis (True ∞ - FE):** Ranges from 0.3 to 0.9 in increments of 0.1.
### Detailed Analysis
The surface plot can be divided into two distinct regions:
1. **Lower Plateau:** For lower values of x'1 and x'2, the surface remains relatively flat and low, with "True ∞ - FE" values hovering around 0.3. This region is colored in dark blue/purple.
2. **Rising Plane:** As x'1 and x'2 increase, the surface rises sharply, indicating a significant increase in the value of "True ∞ - FE". The color transitions from blue/purple to green and finally to yellow as the value increases.
Specifically:
* When x'2 is at 1.0 and x'1 is at 0.0, "True ∞ - FE" is approximately 0.3.
* When x'2 is at 0.0 and x'1 is at 1.0, "True ∞ - FE" is approximately 0.9.
* The transition between the plateau and the rising plane appears to occur when either x'1 or x'2 reaches a value of approximately 0.6.
### Key Observations
* The surface plot shows a non-linear relationship between x'1, x'2, and "True ∞ - FE".
* The value of "True ∞ - FE" is significantly more sensitive to changes in x'1 and x'2 in the rising plane region.
* The plateau region suggests that for certain combinations of x'1 and x'2, "True ∞ - FE" remains relatively constant.
### Interpretation
The plot suggests that "True ∞ - FE" is dependent on both x'1 and x'2, but the nature of this dependence changes depending on the values of x'1 and x'2. The plateau region could indicate a threshold effect, where "True ∞ - FE" only starts to increase significantly once x'1 and x'2 exceed certain values. The rising plane indicates a region where "True ∞ - FE" is highly sensitive to changes in either x'1 or x'2. The specific meaning of "True ∞ - FE", x'1, and x'2 would be needed to provide a more detailed interpretation.