\n
## 3D Surface Plot: True xFF vs. x1 and x2
### Overview
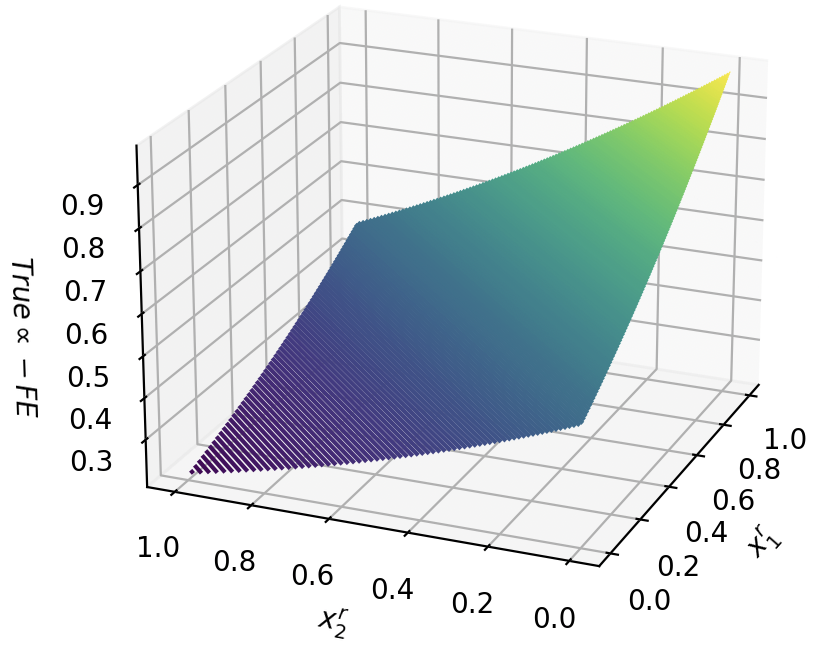
The image displays a 3D surface plot representing the relationship between "True xFF" and two variables, "x1" and "x2". The surface is colored, indicating varying values of "True xFF". The plot is rendered with a grid background for visual clarity.
### Components/Axes
* **X-axis:** Labeled "x1", ranging from approximately 0.0 to 1.0.
* **Y-axis:** Labeled "x2", ranging from approximately 0.0 to 1.0.
* **Z-axis:** Labeled "True xFF", ranging from approximately 0.3 to 0.9.
* **Surface:** The colored surface represents the values of "True xFF" for different combinations of "x1" and "x2". The color gradient transitions from purple/blue at lower values to green at higher values.
* **Grid:** A 3D grid is present in the background, providing a reference for the surface's position and shape.
### Detailed Analysis
The surface exhibits a clear upward trend as both "x1" and "x2" increase.
* **x1 = 0.0:** When x1 is 0.0, "True xFF" starts at approximately 0.3 and increases linearly to approximately 0.9 as x2 increases from 0.0 to 1.0.
* **x2 = 0.0:** When x2 is 0.0, "True xFF" starts at approximately 0.3 and increases linearly to approximately 0.9 as x1 increases from 0.0 to 1.0.
* **x1 = 1.0, x2 = 1.0:** At the point where x1 and x2 both equal 1.0, "True xFF" reaches its maximum value of approximately 0.9.
* **Shape:** The surface is approximately planar, suggesting a linear relationship between "True xFF" and the combined effect of "x1" and "x2".
* **Color Gradient:** The color gradient indicates that lower values of "True xFF" (around 0.3-0.5) are represented by shades of purple and blue, while higher values (around 0.7-0.9) are represented by shades of green.
### Key Observations
* The surface is consistently increasing, indicating a positive correlation between "x1", "x2", and "True xFF".
* The linear nature of the surface suggests that the effect of "x1" and "x2" on "True xFF" is additive.
* There are no apparent outliers or anomalies in the data.
### Interpretation
The plot demonstrates a positive, approximately linear relationship between the variables "x1" and "x2" and the value of "True xFF". This suggests that increasing either "x1" or "x2" (or both) will result in a higher "True xFF" value. The consistent upward trend and lack of anomalies indicate a stable and predictable relationship. Without further context, it's difficult to determine the specific meaning of "True xFF" or the nature of "x1" and "x2", but the plot clearly illustrates their combined influence on the dependent variable. The plot could represent a model or simulation where "True xFF" is a performance metric, and "x1" and "x2" are input parameters. The linear relationship suggests a simple model where the effect of each parameter is directly proportional to its value.