TECHNICAL ASSET FINGERPRINT
a1369a14d2e4eaa50f4bfd08
Click to view fullscreen
Press ESC or click to close
FOUND IN PAPERS
EXPERT: gemma-3-27b-it-free VERSION 1
RUNTIME: google-free/gemma-3-27b-it
INTEL_VERIFIED
## Diagram: GPU-REASON Pipeline & Intra-REASON Pipeline
### Overview
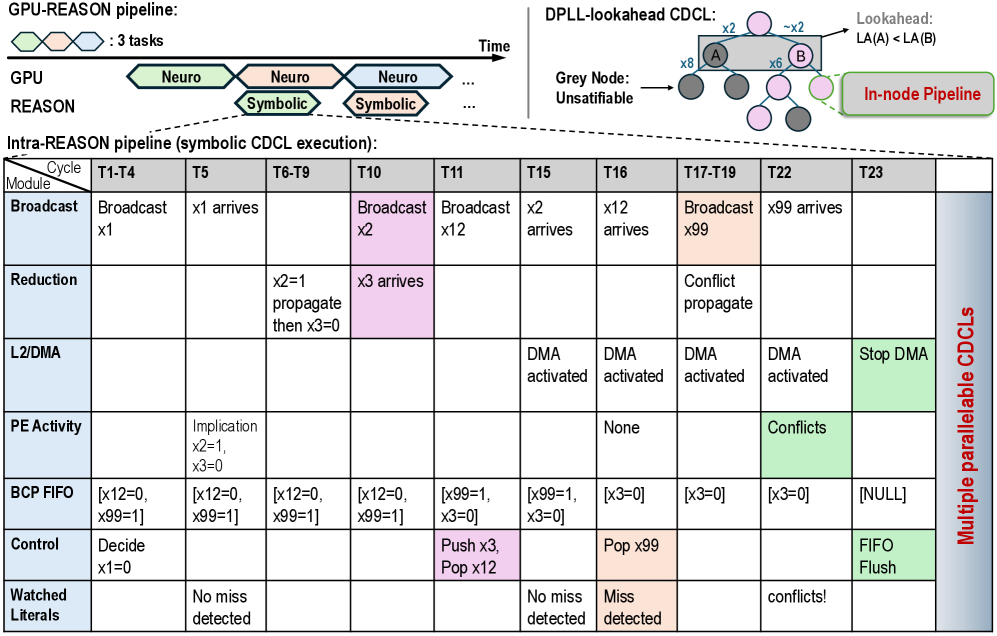
This diagram illustrates the GPU-REASON pipeline and its intra-REASON symbolic CDCL (Conflict-Driven Clause Learning) execution. It depicts the flow of tasks through the GPU and REASON modules over time, detailing the activities within each module during specific cycles (T1-T23). The diagram highlights the parallel processing capabilities of the system using multiple CDCLs.
### Components/Axes
The diagram is structured into several sections:
* **Header:** Shows the overall GPU-REASON pipeline with a timeline and the DPLL-lookahead CDCL process.
* **Main Body:** A table detailing the Intra-REASON pipeline execution, broken down by module (Broadcast, Reduction, L2/DMA, PE Activity, BCP FIFO, Control, Watched Literals) and time cycles (T1-T4, T5, T6-T9, T10, T11, T15, T16, T17-T19, T22, T23).
* **Right Side:** Illustrates the DPLL-lookahead CDCL process with nodes representing decision levels and connections indicating propagation.
* **Legend:** Located on the right side, indicating the meaning of the node colors in the DPLL-lookahead CDCL diagram (Gray: Node Unsatisfiable).
The time axis is represented by cycles labeled T1 through T23. The modules within the Intra-REASON pipeline are listed vertically.
### Detailed Analysis or Content Details
**Header:**
* **GPU:** Shows three tasks labeled "Neuro" and "Symbolic" being processed over time.
* **REASON:** Shows the same tasks being processed.
* **DPLL-lookahead CDCL:** A diagram showing a tree-like structure with nodes. The nodes are connected by lines.
* Node A is labeled "x8".
* Node B is labeled "x6".
* The text "Lookahead: LA(A) < LA(B)" is present.
**Intra-REASON Pipeline (Symbolic CDCL execution):**
| Module | Cycle | Activity/Data |
|-----------------|---------|---------------------------------------------|
| **Broadcast** | T1-T4 | x1 arrives |
| | T5 | x1 arrives |
| | T6-T9 | Broadcast |
| | T10 | Broadcast |
| | T11 | Broadcast x2 arrives |
| | T15 | Broadcast x12 arrives |
| | T16 | Broadcast x12 arrives |
| | T17-T19 | Broadcast x99 arrives |
| | T22 | x99 arrives |
| | T23 | [NULL] |
| **Reduction** | T1-T4 | x1 |
| | T5 | x2=1 propagate then x3=0 |
| | T6-T9 | x3 arrives |
| | T10 | |
| | T11 | |
| | T15 | |
| | T16 | Conflict propagate x99 |
| | T17-T19 | |
| | T22 | |
| | T23 | |
| **L2/DMA** | T1-T4 | |
| | T5 | |
| | T6-T9 | |
| | T10 | DMA activated |
| | T11 | DMA activated |
| | T15 | DMA activated |
| | T16 | DMA activated |
| | T17-T19 | DMA activated |
| | T22 | Stop DMA |
| | T23 | |
| **PE Activity** | T1-T4 | Implication x2=1, x3=0 |
| | T5 | |
| | T6-T9 | |
| | T10 | None |
| | T11 | None |
| | T15 | None |
| | T16 | None |
| | T17-T19 | Conflicts |
| | T22 | |
| | T23 | |
| **BCP FIFO** | T1-T4 | [x12=0, x99=1] |
| | T5 | [x12=0, x99=1] |
| | T6-T9 | [x12=0, x99=1] |
| | T10 | [x99=1, x3=0] |
| | T11 | [x99=1, x3=0] |
| | T15 | [x3=0] |
| | T16 | [x3=0] |
| | T17-T19 | [NULL] |
| | T22 | |
| | T23 | |
| **Control** | T1-T4 | Decide x1=0 |
| | T5 | Push x3, Pop x12 |
| | T6-T9 | |
| | T10 | |
| | T11 | |
| | T15 | |
| | T16 | Pop x99 |
| | T17-T19 | |
| | T22 | FIFO Flush |
| | T23 | |
| **Watched Literals**| T1-T4 | No miss detected |
| | T5 | No miss detected |
| | T6-T9 | Miss detected |
| | T10 | Miss detected |
| | T11 | No miss detected |
| | T15 | No miss detected |
| | T16 | conflicts! |
| | T17-T19 | |
| | T22 | |
| | T23 | |
**Right Side (DPLL-lookahead CDCL):**
* The diagram shows a branching structure, representing the exploration of different decision paths.
* The nodes are colored gray, indicating they are unsatisfiable.
### Key Observations
* The Intra-REASON pipeline demonstrates a clear progression of tasks through the modules over time.
* The Broadcast module frequently receives new data (x1, x2, x12, x99).
* The Reduction module performs propagation and conflict detection.
* The L2/DMA module is activated during cycles T10-T19.
* Conflicts are detected in the PE Activity module during cycle T17-T19.
* The BCP FIFO contains values representing clause assignments.
* The Control module manages decision-making and FIFO operations.
* The Watched Literals module detects missed literals, indicating potential conflicts.
* The DPLL-lookahead CDCL diagram shows a limited search space with all nodes marked as unsatisfiable.
### Interpretation
The diagram illustrates a highly parallel and efficient pipeline for solving problems using symbolic CDCL. The GPU-REASON architecture leverages the GPU for accelerating the REASON module, enabling faster processing of tasks. The Intra-REASON pipeline demonstrates the detailed execution flow within the REASON module, highlighting the interplay between different modules. The parallel CDCLs (indicated by "Multiple parallel CDCLs" on the right) suggest that the system explores multiple solution paths concurrently.
The DPLL-lookahead CDCL diagram, with all nodes marked as unsatisfiable, suggests that the current search space has been exhausted without finding a satisfying solution. This could indicate a complex problem or the need for a different search strategy. The data in the Intra-REASON pipeline table provides a granular view of the system's internal state during the execution process, allowing for detailed performance analysis and optimization. The progression of values in the BCP FIFO and the activities in the Control module reveal the decision-making process and the handling of clause assignments. The "Miss detected" messages in the Watched Literals module indicate potential conflicts that require further investigation.
DECODING INTELLIGENCE...