# Technical Document Extraction: Image Analysis
## Overview
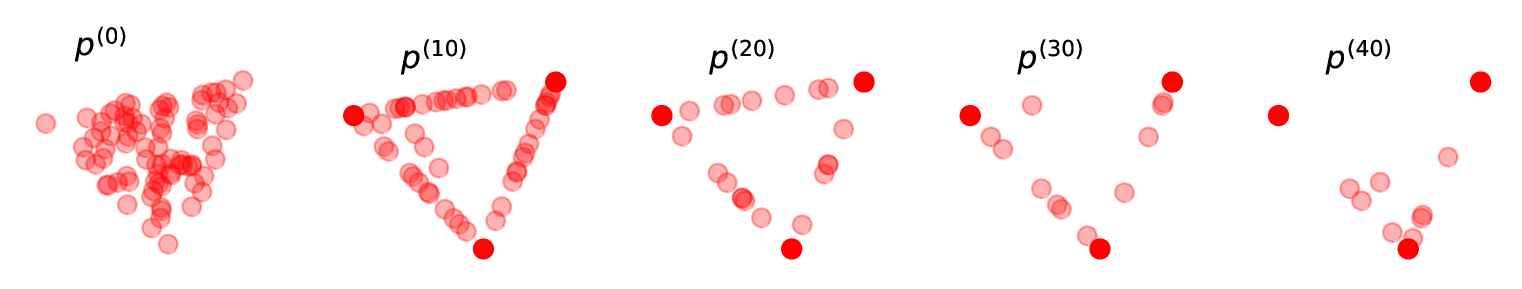
The image consists of **five sequential panels** labeled `p^(0)`, `p^(10)`, `p^(20)`, `p^(30)`, and `p^(40)`, arranged horizontally. Each panel depicts a **triangular arrangement of red dots** with varying density, size, and opacity. The progression across panels suggests a dynamic process or iterative system.
---
## Panel Descriptions
### Panel `p^(0)`
- **Label**: `p^(0)` (top-left corner).
- **Content**:
- **Dense cluster** of overlapping red dots.
- **Size variation**: Most dots are small and semi-transparent, with a few larger, solid red dots.
- **Arrangement**: Triangular formation with high internal density.
### Panel `p^(10)`
- **Label**: `p^(10)` (top-center).
- **Content**:
- **Reduced density** compared to `p^(0)`.
- **Solid red dots** at the **three vertices** of the triangle.
- **Intermediate dots**: Smaller, semi-transparent dots along the edges and interior.
- **Structure**: Maintains triangular shape but with sparser internal distribution.
### Panel `p^(20)`
- **Label**: `p^(20)` (top-right).
- **Content**:
- **Further reduction in density**.
- **Solid red dots** at the **three vertices** (consistent with `p^(10)`).
- **Intermediate dots**: Scattered along edges, fewer than `p^(10)`.
- **Arrangement**: Triangular outline becomes more defined.
### Panel `p^(30)`
- **Label**: `p^(30)` (middle-right).
- **Content**:
- **Minimal density**: Only **solid red dots** at the **three vertices**.
- **Intermediate dots**: Sparse, isolated near edges.
- **Structure**: Triangle outline is faint but discernible.
### Panel `p^(40)`
- **Label**: `p^(40)` (far-right).
- **Content**:
- **Sparse distribution**: Only **three solid red dots** at the **vertices**.
- **No intermediate dots**: Triangle outline is barely visible.
- **Arrangement**: Degenerate triangle (collapsed structure).
---
## Key Observations
1. **Temporal Progression**:
- The system evolves from a **high-density, clustered state** (`p^(0)`) to a **low-density, vertex-dominated state** (`p^(40)`).
- **Trend**: Gradual dispersal of intermediate dots, retention of vertex points.
2. **Dot Categorization**:
- **Solid red dots**: Likely represent **critical nodes** or **anchors** (persistent across all panels).
- **Semi-transparent dots**: Represent **transient or secondary elements** (diminish over time).
3. **Structural Dynamics**:
- The triangular arrangement suggests a **hierarchical or networked system**.
- Vertex points act as **fixed reference points**, while intermediate dots may represent **intermediate states** or **interactions**.
---
## Missing Elements
- **No explicit legend, axis titles, or numerical data** provided in the image.
- **No textual annotations** beyond panel labels (`p^(n)`).
---
## Conclusion
The image illustrates a **dissipative process** where a dense, interconnected system (`p^(0)`) evolves into a sparse, vertex-dominated structure (`p^(40)`). The persistence of solid red dots at vertices implies **invariant components**, while the reduction in intermediate dots suggests **loss of transient interactions** or **system simplification**.