## Line Charts: Paths vs. Time for Different Libraries
### Overview
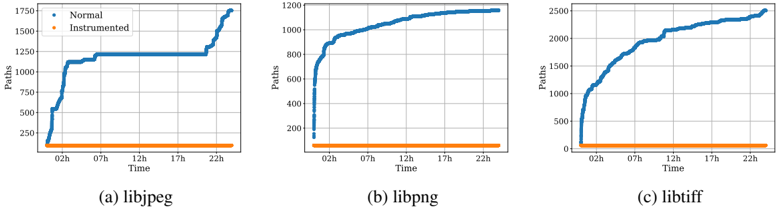
The image presents three line charts comparing the number of paths taken over time for "Normal" and "Instrumented" versions of three different libraries: libjpeg, libpng, and libtiff. The x-axis represents time, and the y-axis represents the number of paths.
### Components/Axes
* **Y-axis (Paths):**
* **libjpeg:** Ranges from 0 to 1750, with markers at 250, 500, 750, 1000, 1250, 1500, and 1750.
* **libpng:** Ranges from 0 to 1200, with markers at 200, 400, 600, 800, 1000, and 1200.
* **libtiff:** Ranges from 0 to 2500, with markers at 500, 1000, 1500, 2000, and 2500.
* **X-axis (Time):**
* All three charts share the same time scale, ranging from approximately 02h to 22h, with markers at 02h, 07h, 12h, 17h, and 22h.
* **Legend (Top-Left):**
* **Blue:** "Normal"
* **Orange:** "Instrumented"
* **Chart Titles:**
* (a) libjpeg
* (b) libpng
* (c) libtiff
### Detailed Analysis
**Chart (a) libjpeg:**
* **Normal (Blue):** The line starts at approximately 0 paths at 02h. It increases sharply to approximately 1100 paths by around 04h. It then plateaus at approximately 1200 paths until around 20h, after which it increases again to approximately 1700 paths by 22h.
* **Instrumented (Orange):** The line remains relatively flat at approximately 100 paths throughout the entire time period.
**Chart (b) libpng:**
* **Normal (Blue):** The line starts at approximately 100 paths at 02h. It increases sharply to approximately 1150 paths by around 06h. After that, it increases slightly to approximately 1200 paths by 22h.
* **Instrumented (Orange):** The line remains relatively flat at approximately 100 paths throughout the entire time period.
**Chart (c) libtiff:**
* **Normal (Blue):** The line starts at approximately 100 paths at 02h. It increases sharply to approximately 2000 paths by around 06h. After that, it increases slightly to approximately 2400 paths by 22h.
* **Instrumented (Orange):** The line remains relatively flat at approximately 100 paths throughout the entire time period.
### Key Observations
* In all three charts, the "Normal" version exhibits a significantly higher number of paths compared to the "Instrumented" version.
* The "Instrumented" version consistently shows a relatively constant number of paths over time.
* The "Normal" versions of libpng and libtiff show a rapid increase in paths early in the time period, followed by a gradual increase.
* The "Normal" version of libjpeg shows a plateau in the middle of the time period, followed by another increase towards the end.
### Interpretation
The data suggests that the "Instrumented" versions of the libraries explore a limited and consistent set of paths, while the "Normal" versions explore a much larger and more dynamic set of paths. The instrumentation process may be limiting the code paths taken, possibly due to added constraints or altered execution flow. The differences in path exploration between the libraries could be attributed to their different functionalities and complexities. The plateau observed in libjpeg's "Normal" version might indicate a specific phase or operation that limits path exploration during that time.