## Line Chart: Path Exploration Over Time for Different Libraries
### Overview
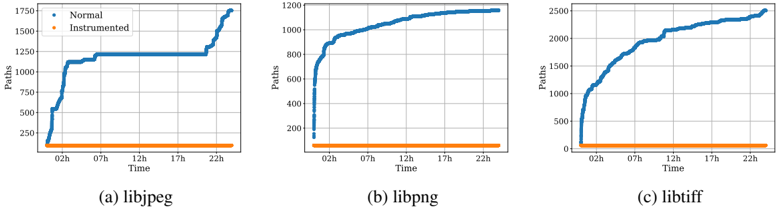
The image presents three line charts, each depicting the number of paths explored over time for different libraries: libjpeg, libpng, and libtiff. Each chart compares the path exploration of a "Normal" execution versus an "Instrumented" execution. The x-axis represents time in hours (02h, 07h, 12h, 17h, 22h), and the y-axis represents the number of paths explored.
### Components/Axes
* **X-axis Label:** "Time" (with markers at 02h, 07h, 12h, 17h, 22h)
* **Y-axis Label:** "Paths" (scale ranging from 0 to approximately 1750 for libjpeg, 0 to 1200 for libpng, and 0 to 2500 for libtiff)
* **Legend:** Located in the top-left corner of each chart.
* "Normal" - Represented by a solid blue line with a circular marker.
* "Instrumented" - Represented by a dashed orange line with a circular marker.
* **Chart Titles:** Located below each chart.
* (a) libjpeg
* (b) libpng
* (c) libtiff
### Detailed Analysis or Content Details
**Chart (a) - libjpeg:**
* **Normal (Blue Line):** The line starts at approximately 50 paths at 02h, rapidly increases to around 300 paths by 07h, plateaus around 1250 paths between 07h and 17h, and then increases sharply to approximately 1700 paths at 22h.
* **Instrumented (Orange Line):** The line remains relatively flat throughout the entire duration, starting at approximately 100 paths at 02h and ending at around 150 paths at 22h.
**Chart (b) - libpng:**
* **Normal (Blue Line):** The line begins at approximately 20 paths at 02h, increases rapidly to around 400 paths by 07h, continues to rise to approximately 1100 paths by 17h, and then plateaus around 1150 paths at 22h.
* **Instrumented (Orange Line):** Similar to libjpeg, the line remains relatively flat, starting at approximately 50 paths at 02h and ending at around 75 paths at 22h.
**Chart (c) - libtiff:**
* **Normal (Blue Line):** The line starts at approximately 100 paths at 02h, increases to around 600 paths by 07h, continues to rise to approximately 2100 paths by 17h, and then increases slightly to around 2300 paths at 22h.
* **Instrumented (Orange Line):** Again, the line remains relatively flat, starting at approximately 25 paths at 02h and ending at around 50 paths at 22h.
### Key Observations
* In all three charts, the "Normal" execution explores significantly more paths than the "Instrumented" execution.
* The "Instrumented" execution shows minimal path exploration across all libraries.
* The "Normal" execution path exploration plateaus at different levels for each library (libjpeg ~1250, libpng ~1100, libtiff ~2100).
* Libtiff shows the highest overall path exploration for the "Normal" execution.
### Interpretation
The data suggests that instrumentation significantly reduces the number of paths explored during testing. This could be due to the overhead introduced by the instrumentation, which limits the program's ability to explore different execution paths within the given time frame. The differences in path exploration between the libraries likely reflect the complexity of each library's code and the effectiveness of the instrumentation in each case. The plateaus in the "Normal" execution curves may indicate that the testing process has reached a point of diminishing returns, where further exploration is unlikely to reveal new paths. The consistent flatness of the "Instrumented" lines suggests that the instrumentation is severely hindering the exploration process, potentially masking important behaviors or vulnerabilities. This could be a critical issue if the goal of instrumentation is to improve test coverage or identify bugs. The fact that libtiff explores the most paths in normal execution suggests it is the most complex of the three libraries, or that the testing setup is more effective at exploring its code.