## [Line Charts]: Comparison of Path Exploration Over Time for Three Libraries
### Overview
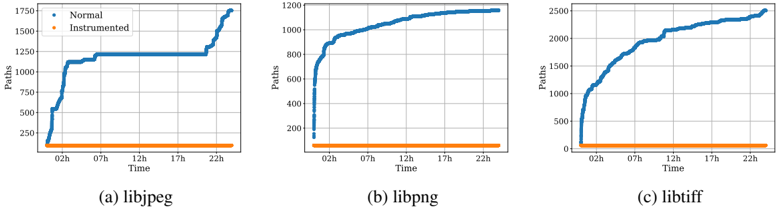
The image displays three horizontally arranged line charts, each comparing the number of "Paths" explored over "Time" for a specific software library under two conditions: "Normal" and "Instrumented." The charts are labeled (a) libjpeg, (b) libpng, and (c) libtiff. The consistent pattern across all three is that the "Normal" execution explores a significantly higher and growing number of paths, while the "Instrumented" execution explores a very low, constant number of paths.
### Components/Axes
* **Chart Layout:** Three separate line charts arranged side-by-side.
* **Common Legend:** Located in the top-left corner of each chart's plot area.
* Blue line with square marker: **Normal**
* Orange line with square marker: **Instrumented**
* **X-Axis (All Charts):**
* **Label:** `Time`
* **Scale:** Linear, from 0 to approximately 24 hours.
* **Major Tick Labels:** `02h`, `07h`, `12h`, `17h`, `22h`.
* **Y-Axis (Varies by Chart):**
* **Label:** `Paths` (for all charts).
* **Scale:** Linear.
* **Chart (a) libjpeg:** Range ~0 to 1750. Major ticks at 250, 500, 750, 1000, 1250, 1500, 1750.
* **Chart (b) libpng:** Range ~0 to 1200. Major ticks at 200, 400, 600, 800, 1000, 1200.
* **Chart (c) libtiff:** Range ~0 to 2500. Major ticks at 500, 1000, 1500, 2000, 2500.
* **Chart Titles/Captions:** Located below each chart.
* (a) `libjpeg`
* (b) `libpng`
* (c) `libtiff`
### Detailed Analysis
**Chart (a) libjpeg:**
* **Normal (Blue Line):** Shows a steep, near-vertical increase from 0 to ~1100 paths within the first 2 hours. The growth then slows, plateauing at approximately 1250 paths from 07h to 22h. There is a final upward trend in the last hour, reaching approximately 1700 paths by 24h.
* **Instrumented (Orange Line):** Remains flat and very close to the x-axis (0 paths) for the entire duration. The value is approximately 0-50 paths.
**Chart (b) libpng:**
* **Normal (Blue Line):** Exhibits a rapid initial increase, reaching ~800 paths by 02h. The growth rate then decreases but remains positive, following a smooth, concave-down curve. It reaches approximately 1150 paths by 22h and appears to approach 1200 by 24h.
* **Instrumented (Orange Line):** Remains flat and constant at a very low value, approximately 0-50 paths, for the entire timeline.
**Chart (c) libtiff:**
* **Normal (Blue Line):** Shows a strong, continuous upward trend. It reaches ~1000 paths by 02h, ~1800 by 07h, and ~2100 by 12h. The growth continues, albeit slightly slower, reaching approximately 2500 paths by 24h. The curve is generally smooth with a minor inflection point around 12h.
* **Instrumented (Orange Line):** Remains flat and constant at a very low value, approximately 0-50 paths, throughout the observed period.
### Key Observations
1. **Dominant Trend:** In all three libraries, the "Normal" execution path count grows substantially over time, while the "Instrumented" execution path count is negligible and static.
2. **Growth Patterns:** The growth of the "Normal" lines differs:
* `libjpeg` shows a two-phase growth: explosive initial exploration followed by a long plateau and a late surge.
* `libpng` shows a classic diminishing returns curve (rapid start, gradual leveling off).
* `libtiff` shows the most sustained and highest overall growth, reaching the highest absolute path count (~2500).
3. **Scale Differences:** The y-axis scales differ, indicating the inherent complexity or test coverage potential varies by library, with `libtiff` allowing for the most path exploration under normal conditions.
4. **Instrumentation Effect:** The effect of instrumentation is drastic and uniform: it appears to severely constrain or halt path exploration, reducing it to a baseline minimum across all libraries.
### Interpretation
This data strongly suggests that the "Instrumented" condition imposes a significant overhead or constraint that fundamentally alters the program's execution behavior, preventing it from exploring its state space. The "Normal" lines likely represent the baseline behavior of a fuzzer or symbolic execution engine exploring the library's code paths.
The differences in the "Normal" curves provide insight into the libraries' structures:
* `libjpeg`'s plateau might indicate a large, complex initial parsing phase followed by a stable processing loop, with the late surge possibly from hitting a new code region.
* `libpng`'s smooth curve suggests a more uniform complexity distribution.
* `libtiff`'s sustained high growth indicates a very large and complex codebase with many reachable paths.
The critical takeaway is that the instrumentation technique being evaluated (the cause of the "Instrumented" line) is not merely adding overhead but is likely interfering with the core mechanism of path exploration (e.g., by breaking feedback loops in a fuzzer or making symbolic constraints unsolvable). For a technical document, this demonstrates a severe limitation or a specific characteristic of the instrumentation method under test, which would be crucial for understanding its impact on analysis tools like fuzzers.