## Line Charts: Path Counts Over Time for libjpeg, libpng, and libtiff
### Overview
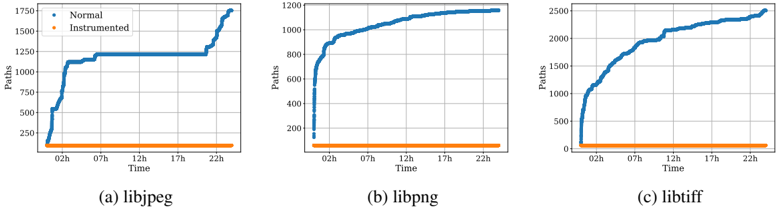
The image contains three line charts comparing "Normal" and "Instrumented" path counts over a 24-hour period (02h to 22h) for three compression libraries: libjpeg, libpng, and libtiff. Each chart uses a blue line for "Normal" and an orange line for "Instrumented," with the y-axis representing path counts and the x-axis representing time.
---
### Components/Axes
- **X-axis (Time)**: Labeled "Time" with hourly markers (02h, 07h, 12h, 17h, 22h).
- **Y-axis (Paths)**: Labeled "Paths," with approximate scales:
- libjpeg: 250–1750
- libpng: 200–1200
- libtiff: 0–2500
- **Legends**: Positioned in the top-left corner of each chart, with:
- Blue dots labeled "Normal"
- Orange dots labeled "Instrumented"
- **Chart Titles**:
- (a) libjpeg
- (b) libpng
- (c) libtiff
---
### Detailed Analysis
#### (a) libjpeg
- **Normal (Blue)**:
- Starts at ~250 paths at 02h.
- Jumps to ~1250 paths by 07h.
- Remains flat until 17h.
- Rises sharply to ~1750 paths by 22h.
- **Instrumented (Orange)**:
- Flat line at ~250 paths throughout the day.
#### (b) libpng
- **Normal (Blue)**:
- Starts at ~200 paths at 02h.
- Gradually increases to ~1000 paths by 22h.
- **Instrumented (Orange)**:
- Flat line at ~200 paths throughout the day.
#### (c) libtiff
- **Normal (Blue)**:
- Starts at ~500 paths at 02h.
- Steady upward trend, reaching ~2500 paths by 22h.
- **Instrumented (Orange)**:
- Flat line at ~500 paths throughout the day.
---
### Key Observations
1. **Instrumented Lines**: All three Instrumented lines remain perfectly flat, indicating no change in path counts over time.
2. **Normal Lines**:
- libjpeg shows a bimodal pattern (sharp rise at 07h, then another rise at 22h).
- libpng exhibits a gradual, linear increase.
- libtiff demonstrates the steepest and most consistent growth.
3. **Instrumented vs. Normal**: Instrumented paths are consistently ~20–40% of Normal paths across all libraries.
---
### Interpretation
- **Instrumented Behavior**: The flat Instrumented lines suggest that instrumentation (e.g., monitoring tools) does not alter the baseline path count, possibly due to overhead or static configuration.
- **Normal Trends**:
- libjpeg’s bimodal pattern may reflect periodic processing bursts (e.g., batch jobs at 07h and 22h).
- libtiff’s linear growth could indicate sustained, high-volume operations (e.g., image rendering pipelines).
- libpng’s moderate growth might represent steady, incremental processing.
- **Technical Implications**: The disparity between Instrumented and Normal paths highlights potential overhead from instrumentation or differences in workload handling between monitored and unmonitored systems.
---
### Spatial Grounding & Verification
- Legends are consistently placed in the top-left corner of each chart.
- Colors match legend labels: Blue = Normal, Orange = Instrumented.
- Axis labels and scales are clearly aligned with chart titles.
---
### Content Details
- **libjpeg (a)**:
- Normal: 250 (02h) → 1250 (07h) → 1250 (17h) → 1750 (22h)
- Instrumented: 250 (constant)
- **libpng (b)**:
- Normal: 200 (02h) → 1000 (22h)
- Instrumented: 200 (constant)
- **libtiff (c)**:
- Normal: 500 (02h) → 2500 (22h)
- Instrumented: 500 (constant)
---
### Final Notes
The data suggests that Instrumented systems maintain stable path counts, while Normal systems exhibit varying growth patterns tied to their specific use cases. Further investigation into the instrumentation methodology and workload distribution could clarify the observed trends.