## Violin Plot: Kimina-7B Distribution Comparison
### Overview
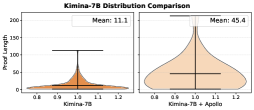
The image presents a side-by-side comparison of two violin plots. The left plot displays the distribution of "Proof Length" for "Kimina-7B", while the right plot shows the distribution for "Kimina-7B + Apollo". The y-axis represents "Proof Length", and the x-axis represents the respective Kimina-7B configurations. Each violin plot shows the distribution shape, median, and interquartile range of the proof lengths.
### Components/Axes
* **Title:** Kimina-7B Distribution Comparison
* **Y-axis:** Proof Length, with scale markers at 0, 50, 100, 150, and 200.
* **X-axis (Left Plot):** Kimina-7B, with scale markers at 0.8, 0.9, 1.0, 1.1, and 1.2.
* **X-axis (Right Plot):** Kimina-7B + Apollo, with scale markers at 0.8, 0.9, 1.0, 1.1, and 1.2.
* **Left Plot Mean:** 11.1
* **Right Plot Mean:** 45.4
* **Violin Plot Color:** Light orange fill with a black outline.
* **Median Line:** Black horizontal line within each violin plot.
* **Interquartile Range:** Black vertical line extending above and below the median.
### Detailed Analysis
**Left Plot (Kimina-7B):**
* The violin plot is narrow and concentrated near the bottom of the y-axis.
* The median proof length is approximately 11.1.
* The interquartile range is relatively small, indicating low variability.
* The distribution is heavily skewed towards shorter proof lengths.
* The bulk of the data is between 0 and 20.
* The maximum proof length is approximately 110.
**Right Plot (Kimina-7B + Apollo):**
* The violin plot is wider and more spread out compared to the left plot.
* The median proof length is approximately 45.4.
* The interquartile range is larger, indicating higher variability.
* The distribution is less skewed compared to the left plot.
* The bulk of the data is between 0 and 70.
* The maximum proof length is approximately 210.
### Key Observations
* The addition of Apollo to Kimina-7B significantly increases the proof length.
* The distribution of proof lengths is more variable with the addition of Apollo.
* The median proof length is substantially higher for Kimina-7B + Apollo.
### Interpretation
The data suggests that integrating Apollo with Kimina-7B leads to a notable increase in proof length and greater variability in proof lengths. This could be due to the increased complexity or different approach introduced by Apollo. The violin plots effectively visualize the shift in distribution and highlight the impact of Apollo on the proof generation process. The mean values further quantify this difference, showing a more than fourfold increase in average proof length.