## Violin Plot: Kimina-7B Distribution Comparison
### Overview
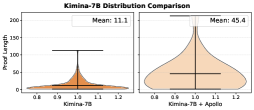
This image displays a side-by-side comparison of two violin plots. The charts illustrate the distribution of a metric called "Proof Length" across two different system configurations: "Kimina-7B" (left) and "Kimina-7B + Apollo" (right). The plots show the density of the data at different values, along with internal markers indicating the range and median, and explicit text boxes stating the mean for each distribution.
### Components/Axes
**Header Region:**
* **Main Title:** "Kimina-7B Distribution Comparison" (Centered at the top).
**Y-Axis (Shared visually, labeled only on the left):**
* **Title:** "Proof Length" (Rotated 90 degrees counter-clockwise, positioned on the far left).
* **Scale/Markers:** Numerical values starting from 0, incrementing by 50 up to 200 (0, 50, 100, 150, 200).
* **Gridlines:** Faint, light-gray horizontal gridlines extend across both plots at each 50-unit interval.
**X-Axes (Individual to each subplot):**
* **Left Subplot Label:** "Kimina-7B"
* **Right Subplot Label:** "Kimina-7B + Apollo"
* **Scale/Markers (Both subplots):** 0.8, 0.9, 1.0, 1.1, 1.2. (These represent the arbitrary width scale used to draw the violin shapes, centered on 1.0).
**Annotations (Legends/Text Boxes):**
* **Left Subplot (Top-Right):** A white rectangular box containing the text "Mean: 11.1".
* **Right Subplot (Top-Right):** A white rectangular box containing the text "Mean: 45.4".
### Detailed Analysis
**Left Plot: Kimina-7B**
* **Visual Trend/Shape:** The distribution is heavily skewed toward the bottom. The violin shape is extremely wide at the base (near zero) and tapers sharply into a very thin, needle-like tail that extends upwards. The color is a solid, medium-dark orange/brown.
* **Data Points (Approximate based on internal markers):**
* **Stated Mean:** 11.1
* **Minimum (Bottom horizontal line):** ~0 to 2
* **Median (Middle horizontal line):** ~10 to 15 (Aligns closely with the stated mean).
* **Maximum (Top horizontal line):** ~110 to 115.
**Right Plot: Kimina-7B + Apollo**
* **Visual Trend/Shape:** The distribution is much broader and extends much higher than the left plot. While still widest near the bottom, the "bulge" of the violin is thicker and extends further up the y-axis (between 20 and 80) before tapering. The tail extends past the visible 200 mark on the y-axis. The color is a lighter, more transparent peach/orange.
* **Data Points (Approximate based on internal markers):**
* **Stated Mean:** 45.4
* **Minimum (Bottom horizontal line):** ~0 to 2
* **Median (Middle horizontal line):** ~45 to 50 (Aligns closely with the stated mean).
* **Maximum (Top horizontal line):** Extends beyond the 200 gridline, approximately ~210 to 220.
### Key Observations
1. **Significant Shift in Mean:** The addition of "Apollo" increases the mean Proof Length by more than a factor of four (from 11.1 to 45.4).
2. **Change in Distribution Shape:** The baseline Kimina-7B model produces almost exclusively very short proofs (clustered tightly around 10). The Kimina-7B + Apollo configuration produces a much wider variety of proof lengths, with a thick distribution of lengths between 20 and 100.
3. **Increased Maximums:** The longest proofs generated by the baseline model cap out around 115. The Apollo-augmented model generates proofs that exceed a length of 200.
### Interpretation
This chart demonstrates the impact of integrating an "Apollo" component or methodology with a base "Kimina-7B" model (likely a 7-billion parameter Large Language Model) on a task involving formal logic, mathematics, or reasoning (indicated by "Proof Length").
The data clearly suggests that the baseline model tends to output very brief, perhaps truncated or overly concise, proofs. By adding Apollo, the system is forced or enabled to generate significantly longer proofs.
*Reading between the lines:* In the context of LLM reasoning, longer "proofs" often correlate with Chain-of-Thought (CoT) reasoning, step-by-step deduction, or more rigorous formal verification. The Apollo addition appears to be a mechanism designed specifically to increase the verbosity, depth, or step-count of the model's reasoning process. The fact that the distribution becomes much wider (rather than just shifting the whole cluster up) implies that Apollo allows the model to dynamically adjust the proof length based on the complexity of the prompt, whereas the base model was seemingly constrained to short outputs regardless of the input.