\n
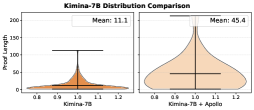
## Violin Plot: Kimina-7B Distribution Comparison
### Overview
The image presents a comparative violin plot illustrating the distribution of "Prof Length" for two models: "Kimina-7B" and "Kimina-7B + Apollo". The plots visually represent the probability density of the data at different values. Each plot also includes a horizontal line indicating the median and a boxplot overlaid on the violin shape, showing the interquartile range. Mean values are explicitly stated above each plot.
### Components/Axes
* **Title:** Kimina-7B Distribution Comparison
* **X-axis:** Model Name (Kimina-7B, Kimina-7B + Apollo)
* **Y-axis:** Prof Length (Scale from 0 to 200, with markings at 0, 50, 100, 150, and 200)
* **Violin Plots:** Two violin plots, one for each model.
* **Boxplots:** Overlaid on each violin plot, showing the median, quartiles, and potential outliers.
* **Mean Labels:** "Mean: 11.1" above the Kimina-7B plot, and "Mean: 45.4" above the Kimina-7B + Apollo plot.
### Detailed Analysis
**Kimina-7B Plot:**
* The violin plot is narrower and more concentrated around lower "Prof Length" values.
* The median line is approximately at a "Prof Length" of 0.9.
* The interquartile range (IQR) is relatively small.
* The mean is 11.1.
* The distribution is heavily skewed to the right, with a long tail extending towards higher "Prof Length" values, but with very low density.
**Kimina-7B + Apollo Plot:**
* The violin plot is wider and more spread out, indicating a greater variance in "Prof Length" values.
* The median line is approximately at a "Prof Length" of 1.0.
* The IQR is larger than that of the Kimina-7B plot.
* The mean is 45.4.
* The distribution is also skewed to the right, but the tail is more pronounced and extends further than the Kimina-7B plot.
### Key Observations
* The "Kimina-7B + Apollo" model exhibits a significantly higher mean "Prof Length" (45.4) compared to the "Kimina-7B" model (11.1).
* The distribution of "Prof Length" is more variable for the "Kimina-7B + Apollo" model, as indicated by the wider violin plot and larger IQR.
* Both distributions are positively skewed.
### Interpretation
The data suggests that adding "Apollo" to the "Kimina-7B" model substantially increases the average "Prof Length". The wider distribution for "Kimina-7B + Apollo" indicates that the addition of "Apollo" introduces more variability in the "Prof Length". The positive skewness in both distributions suggests that while most "Prof Length" values are relatively low, there are some instances of significantly higher values. The difference in means and distributions between the two models suggests that "Apollo" has a significant impact on the "Prof Length" generated by the model. The "Prof Length" is likely a measure of some output characteristic of the models, and the addition of "Apollo" appears to amplify this characteristic. Without knowing what "Prof Length" represents, it's difficult to draw more specific conclusions, but the data clearly demonstrates a substantial difference between the two models.