## Line Chart: Accuracy vs. Thinking Compute
### Overview
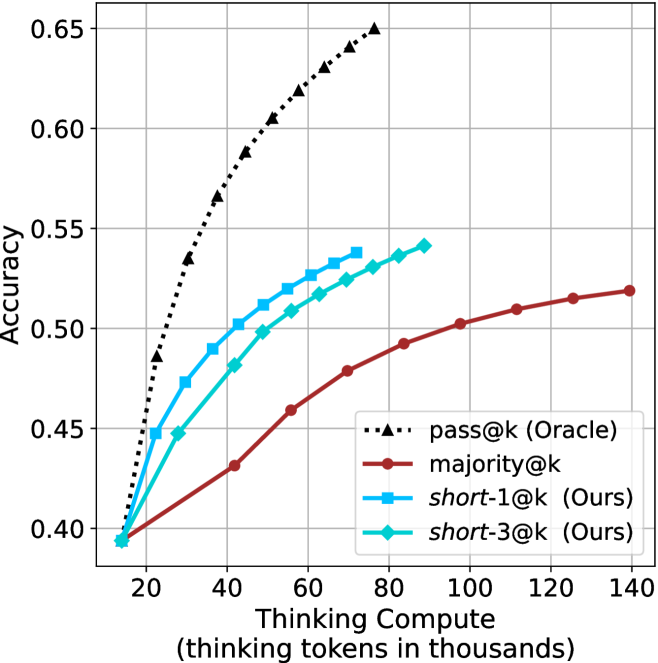
This image presents a line chart illustrating the relationship between "Thinking Compute" (measured in thousands of tokens) and "Accuracy" for several different methods. The chart compares the performance of an "Oracle" method ("pass@k") against three other methods: "majority@k", "short-1@k", and "short-3@k". The methods "short-1@k" and "short-3@k" are identified as "Ours", indicating they are the results of the study.
### Components/Axes
* **X-axis:** "Thinking Compute (thinking tokens in thousands)". Scale ranges from approximately 10 to 140, with markers at 20, 40, 60, 80, 100, 120, and 140.
* **Y-axis:** "Accuracy". Scale ranges from approximately 0.40 to 0.65, with markers at 0.40, 0.45, 0.50, 0.55, 0.60, and 0.65.
* **Legend:** Located in the top-right corner of the chart. Contains the following labels and corresponding line styles/colors:
* "pass@k (Oracle)" - Black dashed line with diamond markers.
* "majority@k" - Brown solid line with circle markers.
* "short-1@k (Ours)" - Blue solid line with square markers.
* "short-3@k (Ours)" - Cyan solid line with triangle markers.
### Detailed Analysis
* **pass@k (Oracle):** This line exhibits a steep upward slope, starting at approximately 0.42 at a compute of 20 and reaching approximately 0.63 at a compute of 80. The line plateaus after 80, with minimal increase in accuracy.
* (20, 0.42)
* (40, 0.56)
* (60, 0.61)
* (80, 0.63)
* (100, 0.63)
* (120, 0.63)
* **majority@k:** This line shows a gradual upward slope, starting at approximately 0.40 at a compute of 20 and reaching approximately 0.52 at a compute of 120.
* (20, 0.40)
* (40, 0.45)
* (60, 0.48)
* (80, 0.50)
* (100, 0.51)
* (120, 0.52)
* **short-1@k (Ours):** This line demonstrates a moderate upward slope, starting at approximately 0.40 at a compute of 20 and reaching approximately 0.53 at a compute of 120.
* (20, 0.40)
* (40, 0.47)
* (60, 0.50)
* (80, 0.52)
* (100, 0.53)
* (120, 0.53)
* **short-3@k (Ours):** This line shows a similar trend to "short-1@k", but with slightly higher accuracy values. It starts at approximately 0.40 at a compute of 20 and reaches approximately 0.55 at a compute of 120.
* (20, 0.40)
* (40, 0.49)
* (60, 0.52)
* (80, 0.54)
* (100, 0.55)
* (120, 0.55)
### Key Observations
* The "pass@k (Oracle)" method significantly outperforms all other methods across the entire range of "Thinking Compute".
* "short-3@k (Ours)" consistently achieves higher accuracy than "short-1@k (Ours)".
* The performance gains for all methods diminish as "Thinking Compute" increases beyond 80.
* "majority@k" has the lowest accuracy across all compute values.
### Interpretation
The chart demonstrates the impact of "Thinking Compute" on the accuracy of different methods. The "Oracle" method, representing an ideal scenario, shows the potential maximum accuracy achievable with increasing compute. The "Ours" methods ("short-1@k" and "short-3@k") represent practical approaches that achieve reasonable accuracy, with "short-3@k" being more effective. The diminishing returns observed at higher compute values suggest that there is a limit to the benefits of increasing compute beyond a certain point. The relatively low performance of "majority@k" indicates that it is not a suitable method for this task. The data suggests that increasing the model's "thinking" capacity (as measured by tokens) improves performance, but the improvement is not linear and plateaus. The comparison between the "Ours" methods and the "Oracle" method highlights the gap between current practical approaches and the theoretical maximum performance.