## Line Graph: Accuracy vs. Thinking Tokens (in Thousands)
### Overview
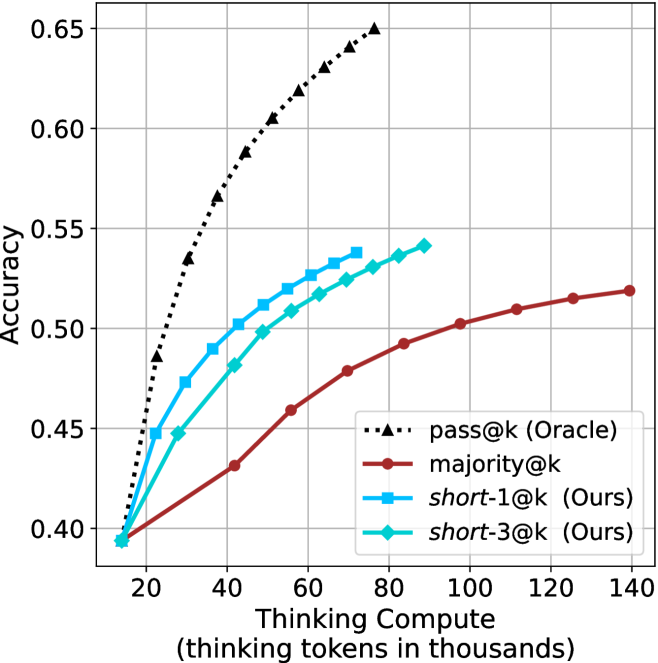
The image is a line graph comparing the accuracy of four different models as a function of "thinking tokens in thousands." The y-axis represents accuracy (ranging from 0.40 to 0.65), and the x-axis represents the number of thinking tokens (in thousands, from 20 to 140). Four data series are plotted, each with distinct markers and colors, as defined in the legend.
---
### Components/Axes
- **X-axis (Horizontal)**: "Thinking tokens in thousands" (20 to 140, in increments of 20).
- **Y-axis (Vertical)**: "Accuracy" (0.40 to 0.65, in increments of 0.05).
- **Legend**: Located on the right side of the graph. Entries include:
- **pass@k (Oracle)**: Black dashed line with triangle markers.
- **majority@k**: Red solid line with circle markers.
- **short-1@k (Ours)**: Blue solid line with square markers.
- **short-3@k (Ours)**: Cyan solid line with diamond markers.
---
### Detailed Analysis
#### 1. **pass@k (Oracle)**
- **Trend**: Steep upward slope, starting at 0.40 (20k tokens) and rising to 0.65 (140k tokens).
- **Key Data Points**:
- 20k tokens: 0.40
- 40k tokens: 0.55
- 80k tokens: 0.60
- 120k tokens: 0.63
- 140k tokens: 0.65
#### 2. **majority@k**
- **Trend**: Gradual upward slope, starting at 0.40 (20k tokens) and rising to 0.52 (140k tokens).
- **Key Data Points**:
- 20k tokens: 0.40
- 40k tokens: 0.43
- 80k tokens: 0.47
- 120k tokens: 0.51
- 140k tokens: 0.52
#### 3. **short-1@k (Ours)**
- **Trend**: Moderate upward slope, starting at 0.40 (20k tokens) and rising to 0.54 (140k tokens).
- **Key Data Points**:
- 20k tokens: 0.40
- 40k tokens: 0.47
- 80k tokens: 0.52
- 120k tokens: 0.53
- 140k tokens: 0.54
#### 4. **short-3@k (Ours)**
- **Trend**: Slightly steeper than short-1@k, starting at 0.40 (20k tokens) and rising to 0.53 (140k tokens).
- **Key Data Points**:
- 20k tokens: 0.40
- 40k tokens: 0.45
- 80k tokens: 0.51
- 120k tokens: 0.53
- 140k tokens: 0.53
---
### Key Observations
1. **pass@k (Oracle)** consistently outperforms all other models, achieving the highest accuracy across all token counts.
2. **majority@k** has the lowest accuracy, showing minimal improvement with increased tokens.
3. **short-1@k** and **short-3@k** (both labeled "Ours") demonstrate similar performance, with short-3@k slightly outperforming short-1@k at higher token counts.
4. All models show diminishing returns as token counts increase beyond 80k.
---
### Interpretation
The graph highlights the relationship between computational resources (thinking tokens) and model performance. The **pass@k (Oracle)** model, likely representing a ground-truth or idealized system, achieves the highest accuracy, suggesting that increased computational capacity directly improves performance. In contrast, the **majority@k** model (a baseline or simple heuristic) shows limited gains, indicating its inefficiency.
The **short-1@k** and **short-3@k** models (labeled "Ours") represent optimized or constrained approaches. While both outperform majority@k, their performance plateaus at higher token counts, suggesting that further resource allocation yields diminishing returns. The slight edge of short-3@k over short-1@k implies that the 3k-token configuration may be more efficient or effective than the 1k-token variant.
The data underscores the trade-off between computational cost and accuracy, with the Oracle model serving as a benchmark for ideal performance. The short models, while resource-efficient, still lag behind the Oracle, highlighting the need for further optimization or alternative strategies to bridge this gap.