## Bar Charts: Comparison of Watermarking Techniques
### Overview
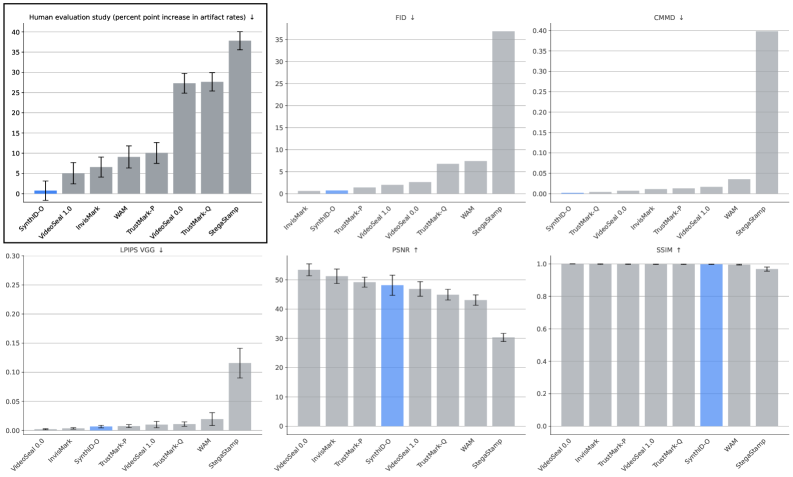
The image presents six bar charts comparing the performance of different watermarking techniques across various metrics: Human evaluation study (percent point increase in artifact rates), FID, CMMD, LPIPS VGG, PSNR, and SSIM. Each chart displays the results for several watermarking methods, including SynthID-0, VideoSeal 1.0, InvisMark, WAM, TrustMark-P, VideoSeal 0.0, TrustMark-Q, and StegaStamp. The charts use error bars to indicate the variability in the data. SynthID-0 is highlighted in blue in some of the charts.
### Components/Axes
**1. Human evaluation study (percent point increase in artifact rates)**
* **Y-axis:** Percent point increase in artifact rates, ranging from 0 to 40.
* **X-axis:** Watermarking methods: SynthID-0, VideoSeal 1.0, InvisMark, WAM, TrustMark-P, VideoSeal 0.0, TrustMark-Q, StegaStamp.
* **Arrow Direction:** Downward arrow next to the title indicates lower values are better.
**2. FID (Fréchet Inception Distance)**
* **Y-axis:** No explicit label, but the scale ranges from 0 to 35.
* **X-axis:** Watermarking methods: InvisMark, SynthID-0, TrustMark-P, VideoSeal 1.0, VideoSeal 0.0, TrustMark-Q, WAM, StegaStamp.
* **Arrow Direction:** Downward arrow next to the title indicates lower values are better.
**3. CMMD (Color Moment Matching Distance)**
* **Y-axis:** No explicit label, but the scale ranges from 0.00 to 0.40.
* **X-axis:** Watermarking methods: SynthID-0, TrustMark-Q, VideoSeal 0.0, InvisMark, TrustMark-P, VideoSeal 1.0, WAM, StegaStamp.
* **Arrow Direction:** Downward arrow next to the title indicates lower values are better.
**4. LPIPS VGG (Learned Perceptual Image Patch Similarity)**
* **Y-axis:** No explicit label, but the scale ranges from 0.00 to 0.30.
* **X-axis:** Watermarking methods: VideoSeal 0.0, InvisMark, SynthID-0, TrustMark-P, VideoSeal 1.0, TrustMark-Q, WAM, StegaStamp.
* **Arrow Direction:** Downward arrow next to the title indicates lower values are better.
**5. PSNR (Peak Signal-to-Noise Ratio)**
* **Y-axis:** No explicit label, but the scale ranges from 0 to 60.
* **X-axis:** Watermarking methods: VideoSeal 0.0, InvisMark, TrustMark-P, SynthID-0, VideoSeal 1.0, TrustMark-Q, WAM, StegaStamp.
* **Arrow Direction:** Upward arrow next to the title indicates higher values are better.
**6. SSIM (Structural Similarity Index Measure)**
* **Y-axis:** No explicit label, but the scale ranges from 0.0 to 1.0.
* **X-axis:** Watermarking methods: VideoSeal 0.0, InvisMark, VideoSeal 1.0, TrustMark-P, TrustMark-Q, SynthID-0, WAM, StegaStamp.
* **Arrow Direction:** Upward arrow next to the title indicates higher values are better.
### Detailed Analysis
**1. Human evaluation study (percent point increase in artifact rates)**
* SynthID-0: ~1%
* VideoSeal 1.0: ~5%
* InvisMark: ~6%
* WAM: ~9%
* TrustMark-P: ~9%
* VideoSeal 0.0: ~27%
* TrustMark-Q: ~28%
* StegaStamp: ~37%
* **Trend:** The artifact rate increases significantly from SynthID-0 to StegaStamp.
**2. FID**
* InvisMark: ~1%
* SynthID-0: ~1%
* TrustMark-P: ~2%
* VideoSeal 1.0: ~2%
* VideoSeal 0.0: ~3%
* TrustMark-Q: ~4%
* WAM: ~7%
* StegaStamp: ~36%
* **Trend:** FID values are low for most methods, with a sharp increase for StegaStamp.
**3. CMMD**
* SynthID-0: ~0.002
* TrustMark-Q: ~0.005
* VideoSeal 0.0: ~0.005
* InvisMark: ~0.01
* TrustMark-P: ~0.01
* VideoSeal 1.0: ~0.01
* WAM: ~0.03
* StegaStamp: ~0.39
* **Trend:** CMMD values are very low for most methods, with a significant spike for StegaStamp.
**4. LPIPS VGG**
* VideoSeal 0.0: ~0.001
* InvisMark: ~0.005
* SynthID-0: ~0.01
* TrustMark-P: ~0.01
* VideoSeal 1.0: ~0.01
* TrustMark-Q: ~0.01
* WAM: ~0.02
* StegaStamp: ~0.11
* **Trend:** LPIPS VGG values are low for most methods, with a noticeable increase for StegaStamp.
**5. PSNR**
* VideoSeal 0.0: ~52
* InvisMark: ~51
* TrustMark-P: ~49
* SynthID-0: ~48
* VideoSeal 1.0: ~47
* TrustMark-Q: ~45
* WAM: ~43
* StegaStamp: ~30
* **Trend:** PSNR values decrease from VideoSeal 0.0 to StegaStamp.
**6. SSIM**
* VideoSeal 0.0: ~0.99
* InvisMark: ~0.99
* VideoSeal 1.0: ~0.99
* TrustMark-P: ~0.99
* TrustMark-Q: ~0.99
* SynthID-0: ~0.99
* WAM: ~0.99
* StegaStamp: ~0.96
* **Trend:** SSIM values are high and relatively consistent across most methods, with a slight decrease for StegaStamp.
### Key Observations
* StegaStamp consistently shows the worst performance in terms of artifact rates, FID, CMMD, LPIPS VGG, PSNR, and SSIM.
* SynthID-0 generally performs well, especially in the human evaluation study and FID metrics.
* VideoSeal 0.0 and InvisMark often exhibit good performance in PSNR and SSIM.
* The error bars indicate some variability in the data, but the overall trends are clear.
### Interpretation
The data suggests that different watermarking techniques have varying impacts on image quality and perceptual artifacts. StegaStamp, while potentially robust, introduces significant distortions, as reflected in the high artifact rates, FID, CMMD, and LPIPS VGG values, as well as the lower PSNR and SSIM values. SynthID-0 appears to strike a better balance between watermarking and image quality, showing low artifact rates and competitive performance across other metrics. VideoSeal 0.0 and InvisMark also demonstrate good performance in preserving image quality, as indicated by their high PSNR and SSIM values.
The choice of watermarking technique should depend on the specific application and the trade-off between robustness and perceptual quality. If minimizing artifacts is a priority, SynthID-0, VideoSeal 0.0, or InvisMark may be preferred. If robustness is paramount, StegaStamp might be considered, but with the understanding that it will likely introduce noticeable distortions.