## Bar Charts: Comparison of Watermarking/Steganography Methods
### Overview
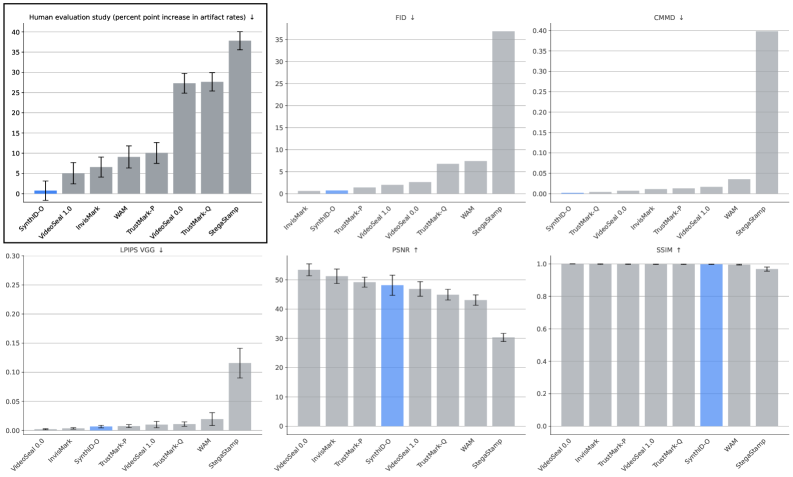
This image presents a grid of six bar charts comparing the performance of eight different watermarking or steganography methods: **SynthID-O, VideoSeal 1.0, InvisMark, WAM, TrustMark-P, VideoSeal 0.0, TrustMark-Q, and StegaStamp**.
The six metrics evaluated are:
1. **Human evaluation study** (percent point increase in artifact rates)
2. **FID** (Fréchet Inception Distance)
3. **CMMD** (Cross-Modal Mean Distance)
4. **LPIPS VGG** (Learned Perceptual Image Patch Similarity)
5. **PSNR** (Peak Signal-to-Noise Ratio)
6. **SSIM** (Structural Similarity Index Measure)
The arrows next to the titles indicate the desired direction for performance: $\downarrow$ means lower is better, and $\uparrow$ means higher is better.
### Components/Axes
* **Layout:** A 2x3 grid of bar charts.
* **X-Axis (All Charts):** Categorical, listing the eight methods. Note that the order of methods on the X-axis varies between charts, likely sorted by performance.
* **Y-Axis:** Numerical scales specific to each metric.
* **Visual Indicators:**
* **Blue Bars:** Used to highlight **SynthID-O** in five of the six charts (Human Evaluation, FID, LPIPS VGG, PSNR, SSIM).
* **Error Bars:** Present in the "Human evaluation study" chart and the "LPIPS VGG" chart, indicating uncertainty or variance.
---
### Detailed Analysis
#### 1. Human evaluation study (percent point increase in artifact rates) $\downarrow$
* **Trend:** Artifact rates increase significantly from left to right.
* **Values (approximate):**
* SynthID-O: ~1% (Blue bar, lowest)
* VideoSeal 1.0: ~5%
* InvisMark: ~6-7%
* WAM: ~9%
* TrustMark-P: ~10%
* VideoSeal 0.0: ~27%
* TrustMark-Q: ~27-28%
* StegaStamp: ~38% (Highest)
#### 2. FID $\downarrow$
* **Trend:** FID scores are low for most methods, with a massive spike for StegaStamp.
* **Values (approximate):**
* InvisMark: ~0.5
* SynthID-O: ~0.8 (Blue bar)
* TrustMark-P: ~1.5
* VideoSeal 1.0: ~2.0
* VideoSeal 0.0: ~2.5
* TrustMark-Q: ~7.0
* WAM: ~7.5
* StegaStamp: ~37.0 (Outlier)
#### 3. CMMD $\downarrow$
* **Trend:** Most methods are clustered near zero, with StegaStamp showing a significantly higher distance.
* **Values (approximate):**
* SynthID-O: ~0.001
* TrustMark-P: ~0.002
* VideoSeal 0.0: ~0.005
* InvisMark: ~0.010
* TrustMark-Q: ~0.012
* VideoSeal 1.0: ~0.015
* WAM: ~0.035
* StegaStamp: ~0.400 (Outlier)
#### 4. LPIPS VGG $\downarrow$
* **Trend:** Perceptual similarity distance is very low for most methods, increasing slightly for WAM and sharply for StegaStamp.
* **Values (approximate):**
* VideoSeal 0.0: ~0.002
* InvisMark: ~0.005
* SynthID-O: ~0.008 (Blue bar)
* TrustMark-P: ~0.010
* VideoSeal 1.0: ~0.012
* TrustMark-Q: ~0.015
* WAM: ~0.020
* StegaStamp: ~0.120
#### 5. PSNR $\uparrow$
* **Trend:** PSNR values are generally high (good), decreasing from left to right.
* **Values (approximate):**
* VideoSeal 0.0: ~53 dB
* InvisMark: ~51 dB
* TrustMark-P: ~49 dB
* SynthID-O: ~48 dB (Blue bar)
* VideoSeal 1.0: ~47 dB
* TrustMark-Q: ~45 dB
* WAM: ~43 dB
* StegaStamp: ~30 dB
#### 6. SSIM $\uparrow$
* **Trend:** All methods perform very well, with values clustered near 1.0.
* **Values (approximate):**
* Most methods (VideoSeal 0.0, InvisMark, TrustMark-P, VideoSeal 1.0, TrustMark-Q, SynthID-O, WAM): ~0.99 - 1.00.
* StegaStamp: ~0.97 (Slightly lower).
---
### Key Observations
* **StegaStamp Outlier:** StegaStamp consistently performs the worst across all metrics (highest artifact rates, highest FID/CMMD/LPIPS, lowest PSNR/SSIM).
* **SynthID-O Performance:** SynthID-O is consistently among the top-performing methods, particularly in human evaluation and perceptual metrics (FID, LPIPS).
* **Metric Consistency:** There is a strong correlation between the metrics; methods that perform well in human evaluation (low artifact rates) also tend to have low FID/LPIPS scores and high PSNR scores.
### Interpretation
The data demonstrates a clear hierarchy in the quality of watermarking/steganography methods. **SynthID-O, VideoSeal, and InvisMark** represent the state-of-the-art, maintaining high image fidelity and low perceptual impact. **StegaStamp** appears to be a legacy or less optimized method, as it introduces significant artifacts and distortion compared to the other models. The use of blue bars to highlight **SynthID-O** suggests the study is likely focused on validating or showcasing the performance of the SynthID-O method against competitors. The consistency across all six metrics provides a robust validation that these methods are effectively balancing the trade-off between watermark robustness (implied) and visual quality.