\n
## Chart: Artifact Rate and Image Quality Metrics Comparison
### Overview
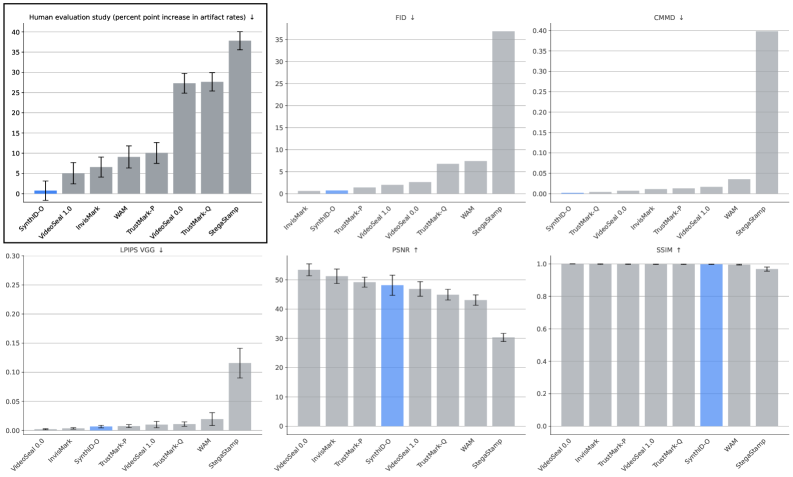
The image presents a comparative analysis of several watermarking techniques (SynthID_0, InvisMark, TrustMark_1.0, TrustMark_6.0, WAM, and StepStamp) across six different metrics: Human evaluation of artifact increase, FID (Fréchet Inception Distance), CMMD (Contrastive Multi-Scale Mean Distance), LPIPS VGG, PSNR (Peak Signal-to-Noise Ratio), and SSIM (Structural Similarity Index Measure). Each metric is visualized using a bar chart with error bars representing variance.
### Components/Axes
The image is divided into six sub-charts, arranged in a 2x3 grid. Each sub-chart represents one of the metrics.
* **X-axis (all charts):** Watermarking Techniques - SynthID_0, InvisMark, TrustMark_1.0, TrustMark_6.0, WAM, StepStamp.
* **Y-axis (Human evaluation):** Percent increase in artifact rates (scale from 0 to 40).
* **Y-axis (FID):** FID score (scale from 0 to 35).
* **Y-axis (CMMD):** CMMD score (scale from 0 to 0.40).
* **Y-axis (LPIPS VGG):** LPIPS VGG score (scale from 0 to 0.25).
* **Y-axis (PSNR):** PSNR score (scale from 10 to 50).
* **Y-axis (SSIM):** SSIM score (scale from 0 to 1.0).
* **Error Bars:** Represent the variance or standard deviation of the metric for each watermarking technique.
### Detailed Analysis
**1. Human Evaluation (Artifact Increase):**
The bars show the percent increase in artifact rates.
* SynthID_0: Approximately 8% ± 2%
* InvisMark: Approximately 10% ± 2%
* TrustMark_1.0: Approximately 11% ± 3%
* TrustMark_6.0: Approximately 22% ± 4%
* WAM: Approximately 32% ± 5%
* StepStamp: Approximately 38% ± 4%
The trend is clearly upward, with StepStamp introducing the highest artifact increase.
**2. FID:**
The bars show the FID score.
* SynthID_0: Approximately 2% ± 1%
* InvisMark: Approximately 3% ± 1%
* TrustMark_1.0: Approximately 4% ± 1%
* TrustMark_6.0: Approximately 5% ± 1%
* WAM: Approximately 10% ± 2%
* StepStamp: Approximately 28% ± 3%
The trend is upward, with StepStamp having the highest FID score.
**3. CMMD:**
The bars show the CMMD score.
* SynthID_0: Approximately 0.02% ± 0.01%
* InvisMark: Approximately 0.03% ± 0.01%
* TrustMark_1.0: Approximately 0.04% ± 0.01%
* TrustMark_6.0: Approximately 0.06% ± 0.01%
* WAM: Approximately 0.12% ± 0.02%
* StepStamp: Approximately 0.30% ± 0.03%
The trend is upward, with StepStamp having the highest CMMD score.
**4. LPIPS VGG:**
The bars show the LPIPS VGG score.
* VideoSeal_0.0: Approximately 0.01% ± 0.005%
* SynthID_0: Approximately 0.02% ± 0.005%
* TrustMark_1.0: Approximately 0.03% ± 0.005%
* TrustMark_6.0: Approximately 0.05% ± 0.01%
* WAM: Approximately 0.15% ± 0.02%
* StepStamp: Approximately 0.23% ± 0.03%
The trend is upward, with StepStamp having the highest LPIPS VGG score.
**5. PSNR:**
The bars show the PSNR score.
* VideoSeal_0.0: Approximately 48% ± 1%
* InvisMark: Approximately 49% ± 1%
* TrustMark_1.0: Approximately 47% ± 1%
* TrustMark_6.0: Approximately 45% ± 1%
* WAM: Approximately 40% ± 2%
* StepStamp: Approximately 30% ± 2%
The trend is downward, with StepStamp having the lowest PSNR score.
**6. SSIM:**
The bars show the SSIM score.
* VideoSeal_0.0: Approximately 0.98% ± 0.01%
* InvisMark: Approximately 0.97% ± 0.01%
* TrustMark_1.0: Approximately 0.96% ± 0.01%
* TrustMark_6.0: Approximately 0.94% ± 0.01%
* WAM: Approximately 0.85% ± 0.02%
* StepStamp: Approximately 0.70% ± 0.02%
The trend is downward, with StepStamp having the lowest SSIM score.
### Key Observations
* StepStamp consistently performs the worst across most metrics, exhibiting the highest artifact increase (Human Evaluation, FID, CMMD, LPIPS VGG) and the lowest image quality (PSNR, SSIM).
* SynthID_0 and InvisMark generally show the best performance, with low artifact increase and high image quality scores.
* TrustMark_6.0 shows a moderate increase in artifacts and a slight decrease in image quality compared to TrustMark_1.0.
* WAM introduces a noticeable increase in artifacts and a decrease in image quality.
### Interpretation
The data suggests a trade-off between the robustness of a watermarking technique and its impact on image quality. StepStamp, while potentially more robust, introduces significant artifacts and degrades image quality as measured by FID, CMMD, LPIPS VGG, PSNR, and SSIM. SynthID_0 and InvisMark appear to offer a better balance, minimizing artifacts while maintaining high image quality. The human evaluation corroborates these findings, with StepStamp receiving the highest artifact increase rating.
The consistent pattern across metrics indicates that the observed trends are not random fluctuations but rather inherent characteristics of each watermarking technique. The differences in performance likely stem from the underlying algorithms and the way each technique embeds the watermark into the image. The choice of watermarking technique should therefore depend on the specific application and the relative importance of robustness versus image quality. The data also suggests that increasing the complexity of TrustMark (from 1.0 to 6.0) leads to a slight degradation in performance.