TECHNICAL ASSET FINGERPRINT
a1a8160950fe38cfc160917a
Click to view fullscreen
Press ESC or click to close
FOUND IN PAPERS
EXPERT: healer-alpha-free VERSION 1
RUNTIME: free/openrouter/healer-alpha
INTEL_VERIFIED
## Bar Charts: Comparative Performance of Image/Video Watermarking Methods
### Overview
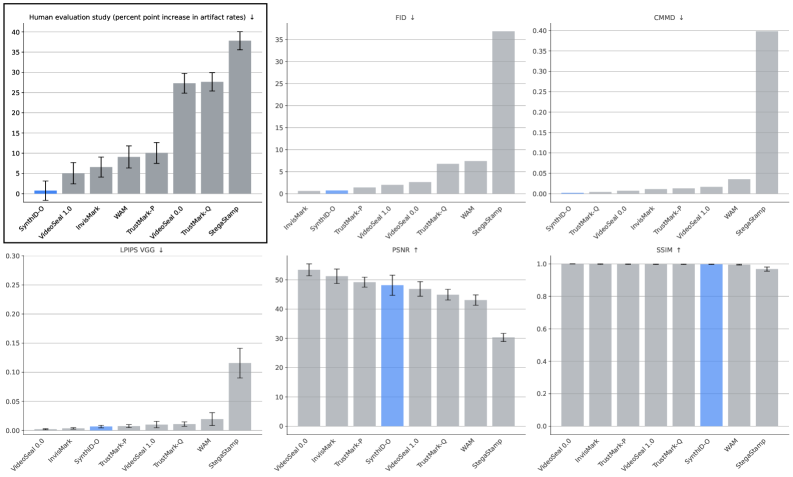
The image displays a composite of six bar charts arranged in a 2x3 grid. Each chart compares the performance of different watermarking or content-protection methods across various quantitative metrics. One method, "SynthID-Q," is consistently highlighted in blue across all charts for easy identification. The charts collectively assess trade-offs between robustness, imperceptibility, and human-perceived quality.
### Components/Axes
**General Layout:**
- Six individual bar charts in a grid.
- Each chart has a title indicating the metric being measured.
- The y-axis represents the metric value. An arrow (↓ or ↑) next to the title indicates whether a lower (↓) or higher (↑) value is desirable.
- The x-axis lists the names of the methods being compared. The order of methods varies slightly between charts.
- Error bars are present on all bars, indicating variability or confidence intervals.
- A single bar in each chart is colored blue; this bar corresponds to the method "SynthID-Q."
**Chart-Specific Details:**
1. **Top-Left: Human evaluation study**
* **Title:** `Human evaluation study (percent point increase in artifact rates) ↓`
* **Y-axis:** Scale from 0 to 40, increments of 5.
* **X-axis (Methods, left to right):** SynthID-Q, VideoSeal 1.0, InvMark, WAM, TrustMark-Ω, VideoSeal 1.5, TrustMark-Q, StegaStamp.
* **Legend/Highlight:** The first bar (SynthID-Q) is blue.
2. **Top-Center: FID**
* **Title:** `FID ↓`
* **Y-axis:** Scale from 0 to 35, increments of 5.
* **X-axis (Methods, left to right):** InvMark, SynthID-Q, TrustMark-Ω, VideoSeal 1.0, VideoSeal 1.5, TrustMark-Q, WAM, StegaStamp.
* **Legend/Highlight:** The second bar (SynthID-Q) is blue.
3. **Top-Right: CMMD**
* **Title:** `CMMD ↓`
* **Y-axis:** Scale from 0.00 to 0.40, increments of 0.05.
* **X-axis (Methods, left to right):** SynthID-Q, TrustMark-Q, VideoSeal 1.5, InvMark, TrustMark-Ω, VideoSeal 1.0, WAM, StegaStamp.
* **Legend/Highlight:** The first bar (SynthID-Q) is blue.
4. **Bottom-Left: LPIPS VGG**
* **Title:** `LPIPS VGG ↓`
* **Y-axis:** Scale from 0.00 to 0.30, increments of 0.05.
* **X-axis (Methods, left to right):** VideoSeal 1.0, InvMark, SynthID-Q, TrustMark-Ω, VideoSeal 1.5, TrustMark-Q, WAM, StegaStamp.
* **Legend/Highlight:** The third bar (SynthID-Q) is blue.
5. **Bottom-Center: PSNR**
* **Title:** `PSNR ↑`
* **Y-axis:** Scale from 0 to 50, increments of 10.
* **X-axis (Methods, left to right):** VideoSeal 1.0, InvMark, TrustMark-Ω, SynthID-Q, VideoSeal 1.5, TrustMark-Q, WAM, StegaStamp.
* **Legend/Highlight:** The fourth bar (SynthID-Q) is blue.
6. **Bottom-Right: SSIM**
* **Title:** `SSIM ↑`
* **Y-axis:** Scale from 0.0 to 1.0, increments of 0.2.
* **X-axis (Methods, left to right):** VideoSeal 1.0, InvMark, VideoSeal 1.5, TrustMark-Ω, SynthID-Q, WAM, StegaStamp.
* **Legend/Highlight:** The fifth bar (SynthID-Q) is blue.
### Detailed Analysis
**1. Human Evaluation (Artifact Rates - Lower is Better):**
* **Trend:** A clear upward trend from left to right. SynthID-Q has the lowest increase in artifact rates, while StegaStamp has the highest.
* **Approximate Values (Percent Point Increase):**
* SynthID-Q (Blue): ~1.5
* VideoSeal 1.0: ~5
* InvMark: ~7
* WAM: ~9
* TrustMark-Ω: ~10
* VideoSeal 1.5: ~27
* TrustMark-Q: ~27
* StegaStamp: ~38
**2. FID (Fréchet Inception Distance - Lower is Better):**
* **Trend:** Most methods have low FID scores (<5). There is a sharp increase for the last two methods, with StegaStamp being a significant outlier.
* **Approximate Values:**
* InvMark: ~0.5
* SynthID-Q (Blue): ~1.0
* TrustMark-Ω: ~2.0
* VideoSeal 1.0: ~2.5
* VideoSeal 1.5: ~3.0
* TrustMark-Q: ~7.0
* WAM: ~7.5
* StegaStamp: ~37.0
**3. CMMD (Lower is Better):**
* **Trend:** Similar to FID, most methods score very low (<0.05). StegaStamp is again a major outlier with a much higher value.
* **Approximate Values:**
* SynthID-Q (Blue): ~0.005
* TrustMark-Q: ~0.01
* VideoSeal 1.5: ~0.015
* InvMark: ~0.02
* TrustMark-Ω: ~0.02
* VideoSeal 1.0: ~0.025
* WAM: ~0.04
* StegaStamp: ~0.40
**4. LPIPS VGG (Learned Perceptual Image Patch Similarity - Lower is Better):**
* **Trend:** Very low values for the first six methods, with a slight increase for WAM and a larger jump for StegaStamp.
* **Approximate Values:**
* VideoSeal 1.0: ~0.002
* InvMark: ~0.003
* SynthID-Q (Blue): ~0.005
* TrustMark-Ω: ~0.007
* VideoSeal 1.5: ~0.008
* TrustMark-Q: ~0.01
* WAM: ~0.025
* StegaStamp: ~0.12
**5. PSNR (Peak Signal-to-Noise Ratio - Higher is Better):**
* **Trend:** A gradual downward trend from left to right. VideoSeal 1.0 has the highest PSNR, while StegaStamp has the lowest.
* **Approximate Values (dB):**
* VideoSeal 1.0: ~53
* InvMark: ~51
* TrustMark-Ω: ~49
* SynthID-Q (Blue): ~48
* VideoSeal 1.5: ~47
* TrustMark-Q: ~45
* WAM: ~43
* StegaStamp: ~30
**6. SSIM (Structural Similarity Index - Higher is Better):**
* **Trend:** All methods achieve very high SSIM scores (close to 1.0), indicating high structural similarity to the original. There is a very slight downward trend, with StegaStamp showing the most noticeable drop.
* **Approximate Values:**
* VideoSeal 1.0: ~0.995
* InvMark: ~0.995
* VideoSeal 1.5: ~0.995
* TrustMark-Ω: ~0.995
* SynthID-Q (Blue): ~0.995
* WAM: ~0.99
* StegaStamp: ~0.97
### Key Observations
1. **Consistent Outlier:** The method "StegaStamp" is a consistent outlier, performing worst (highest value) on all "lower-is-better" metrics (FID, CMMD, LPIPS, Human Artifacts) and worst (lowest value) on the "higher-is-better" PSNR metric. It also shows the largest drop in SSIM.
2. **SynthID-Q Performance:** The highlighted method, SynthID-Q, generally performs very well. It has the lowest human-perceived artifact rate, competitive (low) scores on FID, CMMD, and LPIPS, and strong (high) scores on PSNR and SSIM.
3. **Metric Clustering:** Methods like VideoSeal (1.0 & 1.5), InvMark, and TrustMark variants often cluster together in performance, forming a middle tier between the top-performing SynthID-Q and the poorly-performing StegaStamp/WAM on several metrics.
4. **Human vs. Computational Metrics:** There is a notable discrepancy between the human evaluation chart and the computational metrics (FID, CMMD, LPIPS). While SynthID-Q is best in human evaluation, it is not always the absolute best on computational metrics (e.g., VideoSeal 1.0 has a slightly better PSNR). This suggests computational metrics may not perfectly correlate with human perception of artifacts.
### Interpretation
This composite chart provides a multi-faceted evaluation of watermarking techniques, revealing critical trade-offs. The data suggests that **SynthID-Q achieves a superior balance between imperceptibility and robustness**. It introduces the fewest visible artifacts according to human evaluators while maintaining strong performance on objective image quality metrics (FID, PSNR, SSIM).
The dramatic underperformance of **StegaStamp** across all metrics indicates it may be a less sophisticated or older method, causing significant distortion. The clustering of other methods suggests incremental improvements among them.
The key investigative insight is the **divergence between human evaluation and some computational metrics**. A method can score well on PSNR or SSIM (which measure pixel-level or structural fidelity) but still introduce artifacts noticeable to humans (as seen with VideoSeal 1.5 having a high artifact rate despite decent PSNR/SSIM). This underscores the importance of including human-in-the-loop evaluation for tasks where perceptual quality is paramount. The charts collectively argue that the optimal watermarking method is not necessarily the one that maximizes a single computational score, but the one that best minimizes human-perceived degradation while maintaining sufficient signal strength for detection.
DECODING INTELLIGENCE...