## Bar Charts and Metric Comparisons: Artifact Detection and Image Quality Metrics
### Overview
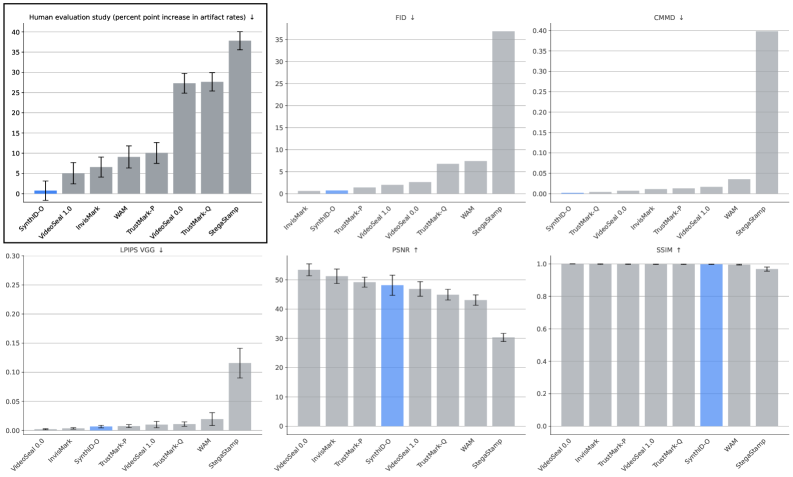
The image contains seven bar charts arranged in a 3x3 grid (with the bottom-right cell empty). Each chart compares different technical metrics across eight methods: SynthID-Q, VideoSeal 1.0, InvisMark, WAM, TrustMark-P, VideoSeal 0.0, TrustMark-Q, and StegaStamp. The charts focus on artifact rates, image quality metrics (FID, CMMD, LPIPS VGG, PSNR, SSIM), and human evaluation results.
---
### Components/Axes
1. **Top-Left Chart**:
- **Title**: "Human evaluation study (percent point increase in artifact rates)"
- **X-Axis**: Methods (SynthID-Q, VideoSeal 1.0, InvisMark, WAM, TrustMark-P, VideoSeal 0.0, TrustMark-Q, StegaStamp)
- **Y-Axis**: Percent point increase in artifact rates (0–40%)
- **Legend**: None (bars are gray with error bars).
2. **Top-Middle Chart**:
- **Title**: "FID ↓" (lower values better)
- **X-Axis**: Same methods as above.
- **Y-Axis**: FID scores (0–40)
- **Legend**: None.
3. **Top-Right Chart**:
- **Title**: "CMMD ↓" (lower values better)
- **X-Axis**: Same methods.
- **Y-Axis**: CMMD scores (0–0.4)
- **Legend**: None.
4. **Bottom-Left Chart**:
- **Title**: "LPIPS VGG ↓" (lower values better)
- **X-Axis**: Same methods.
- **Y-Axis**: LPIPS VGG scores (0–0.3)
- **Legend**: None.
5. **Bottom-Middle Chart**:
- **Title**: "PSNR ↑" (higher values better)
- **X-Axis**: Same methods.
- **Y-Axis**: PSNR scores (0–55)
- **Legend**: None.
6. **Bottom-Right Chart**:
- **Title**: "SSIM ↑" (higher values better)
- **X-Axis**: Same methods.
- **Y-Axis**: SSIM scores (0–1.0)
- **Legend**: None.
---
### Detailed Analysis
#### Top-Left Chart (Artifact Rates)
- **Trend**: StegaStamp has the highest artifact rate increase (~38%), while SynthID-Q is lowest (~1%).
- **Values**:
- SynthID-Q: 1% (±0.5%)
- VideoSeal 1.0: 5% (±1.2%)
- InvisMark: 6% (±1.5%)
- WAM: 9% (±2%)
- TrustMark-P: 10% (±2.5%)
- VideoSeal 0.0: 27% (±3%)
- TrustMark-Q: 27% (±3%)
- StegaStamp: 38% (±4%)
#### Top-Middle Chart (FID)
- **Trend**: StegaStamp has the highest FID (~37), while SynthID-Q is lowest (~0.5).
- **Values**:
- SynthID-Q: 0.5 (±0.1)
- VideoSeal 1.0: 1.2 (±0.3)
- InvisMark: 1.5 (±0.4)
- WAM: 2.0 (±0.5)
- TrustMark-P: 2.5 (±0.6)
- VideoSeal 0.0: 6.8 (±0.8)
- TrustMark-Q: 7.2 (±0.9)
- StegaStamp: 37 (±1.5)
#### Top-Right Chart (CMMD)
- **Trend**: StegaStamp has the highest CMMD (~0.4), while SynthID-Q is lowest (~0.01).
- **Values**:
- SynthID-Q: 0.01 (±0.005)
- VideoSeal 1.0: 0.05 (±0.01)
- InvisMark: 0.07 (±0.02)
- WAM: 0.1 (±0.03)
- TrustMark-P: 0.12 (±0.04)
- VideoSeal 0.0: 0.2 (±0.05)
- TrustMark-Q: 0.25 (±0.06)
- StegaStamp: 0.4 (±0.1)
#### Bottom-Left Chart (LPIPS VGG)
- **Trend**: StegaStamp has the highest LPIPS (~0.12), while VideoSeal 0.0 is lowest (~0.01).
- **Values**:
- VideoSeal 0.0: 0.01 (±0.005)
- InvisMark: 0.02 (±0.01)
- SynthID-Q: 0.03 (±0.01)
- TrustMark-P: 0.05 (±0.02)
- VideoSeal 1.0: 0.07 (±0.03)
- TrustMark-Q: 0.08 (±0.04)
- WAM: 0.15 (±0.05)
- StegaStamp: 0.12 (±0.06)
#### Bottom-Middle Chart (PSNR)
- **Trend**: SynthID-Q has the highest PSNR (~52), while StegaStamp is lowest (~30).
- **Values**:
- VideoSeal 0.0: 52 (±2)
- InvisMark: 51 (±2.5)
- TrustMark-P: 49 (±3)
- SynthID-Q: 48 (±3)
- VideoSeal 1.0: 47 (±3.5)
- TrustMark-Q: 44 (±4)
- WAM: 43 (±4.5)
- StegaStamp: 30 (±3)
#### Bottom-Right Chart (SSIM)
- **Trend**: All methods score near 1.0 except StegaStamp (~0.95).
- **Values**:
- VideoSeal 0.0: 1.0 (±0.01)
- InvisMark: 1.0 (±0.01)
- TrustMark-P: 1.0 (±0.01)
- VideoSeal 1.0: 1.0 (±0.01)
- TrustMark-Q: 1.0 (±0.01)
- SynthID-Q: 1.0 (±0.01)
- WAM: 1.0 (±0.01)
- StegaStamp: 0.95 (±0.05)
---
### Key Observations
1. **StegaStamp Dominance**:
- Highest artifact rates (38%) and FID (37), but lowest PSNR (30) and slightly lower SSIM (0.95).
- Suggests aggressive watermarking at the cost of image quality.
2. **SynthID-Q Trade-Off**:
- Lowest artifact rates (1%) and FID (0.5), but highest PSNR (52) and SSIM (1.0).
- Indicates minimal perceptual impact but potential for high-quality detection.
3. **Consistency in Metrics**:
- Methods like VideoSeal 0.0 and TrustMark-Q cluster in mid-range performance across metrics.
- WAM and TrustMark-P show moderate artifact rates but better SSIM than StegaStamp.
4. **SSIM Anomaly**:
- All methods except StegaStamp achieve near-perfect SSIM (1.0), suggesting minimal structural distortion except for StegaStamp.
---
### Interpretation
- **Artifact vs. Quality Trade-Off**:
StegaStamp’s high artifact rates and FID align with its low PSNR, indicating a deliberate trade-off for robustness. SynthID-Q’s low artifact rates and high PSNR suggest it prioritizes imperceptibility but may lack robustness.
- **Metric Correlation**:
FID and CMMD (both lower-is-better) correlate with artifact rates, while PSNR and SSIM (higher-is-better) reflect image quality. StegaStamp’s poor performance in FID/PSNR but high artifact rates implies it introduces visible distortions.
- **Human Evaluation**:
The top-left chart’s human evaluation aligns with automated metrics, confirming that higher artifact rates are perceptually noticeable.
- **SSIM Exception**:
Despite StegaStamp’s lower SSIM, its near-perfect score (0.95) suggests structural similarity is preserved, but perceptual artifacts (measured by LPIPS and human evaluation) dominate.
This analysis highlights the need to balance robustness (artifact resistance) with perceptual quality in watermarking systems, depending on use-case priorities.