# Technical Document Extraction: Roofline Model Analysis
## 1. Document Metadata
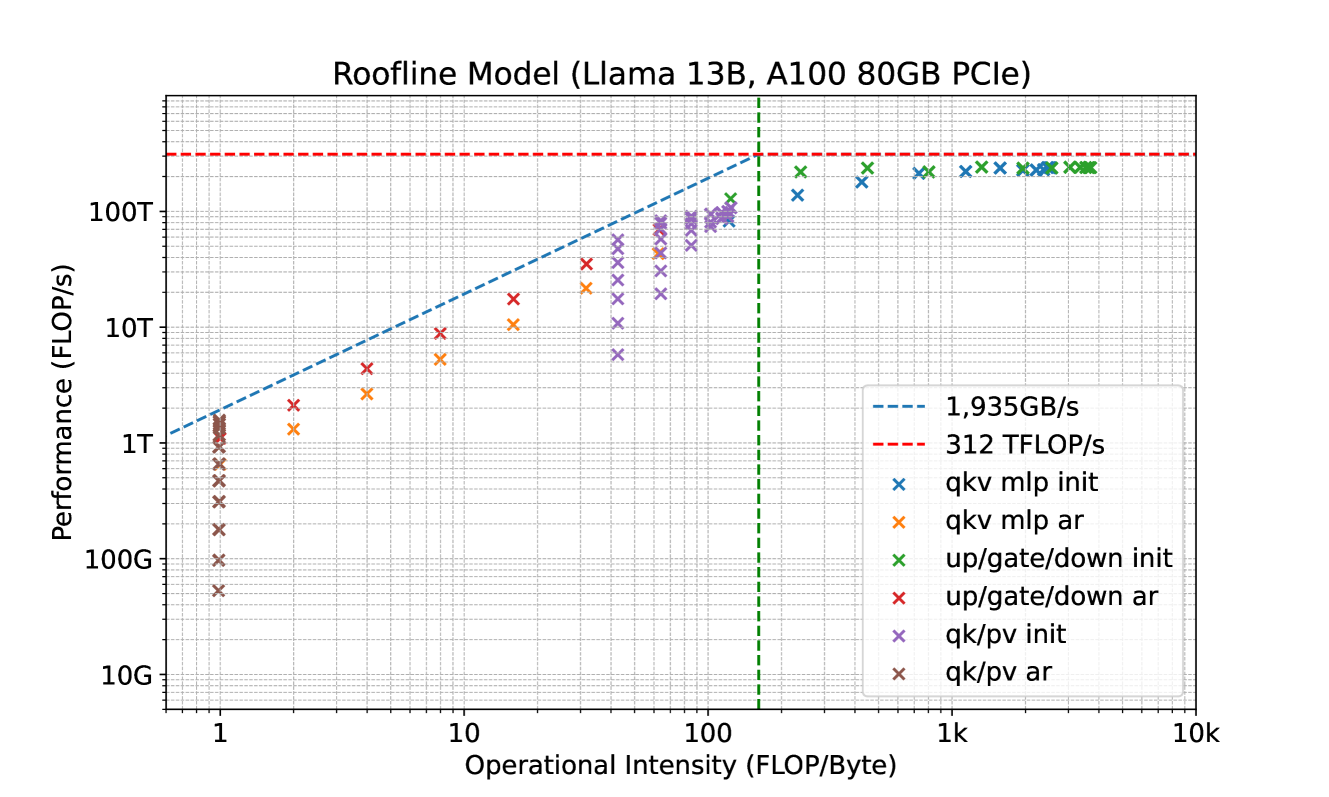
* **Title:** Roofline Model (Llama 13B, A100 80GB PCIe)
* **Primary Language:** English
* **Chart Type:** Log-Log Roofline Plot (Performance vs. Operational Intensity)
---
## 2. Component Isolation
### A. Header
* **Text:** "Roofline Model (Llama 13B, A100 80GB PCIe)"
* **Context:** This chart evaluates the performance of a Llama 13B large language model running on an NVIDIA A100 80GB PCIe GPU.
### B. Axes and Scale
* **Y-Axis (Vertical):**
* **Label:** Performance (FLOP/s)
* **Scale:** Logarithmic, ranging from 10G to 1000T (10^10 to 10^15).
* **Major Markers:** 10G, 100G, 1T, 10T, 100T.
* **X-Axis (Horizontal):**
* **Label:** Operational Intensity (FLOP/Byte)
* **Scale:** Logarithmic, ranging from 1 to 10k (10^0 to 10^4).
* **Major Markers:** 1, 10, 100, 1k, 10k.
### C. Legend (Spatial Grounding: Bottom Right [x≈0.7, y≈0.2])
The legend defines the theoretical limits and the specific kernel operations measured.
| Legend Item | Color/Style | Description |
| :--- | :--- | :--- |
| **1,935GB/s** | Blue Dashed Line (Sloped) | Memory Bandwidth Limit |
| **312 TFLOP/s** | Red Dashed Line (Horizontal) | Peak Compute Performance Limit |
| **qkv mlp init** | Blue 'x' | Initialization phase for QKV and MLP layers |
| **qkv mlp ar** | Orange 'x' | Autoregressive phase for QKV and MLP layers |
| **up/gate/down init** | Green 'x' | Initialization phase for Up/Gate/Down projection layers |
| **up/gate/down ar** | Red 'x' | Autoregressive phase for Up/Gate/Down projection layers |
| **qk/pv init** | Purple 'x' | Initialization phase for QK/PV attention scores |
| **qk/pv ar** | Brown 'x' | Autoregressive phase for QK/PV attention scores |
---
## 3. Theoretical Limits (The "Roofline")
1. **Memory Bound (Sloped Line):** A blue dashed line representing a bandwidth of **1,935 GB/s**. It slopes upward from left to right, indicating that at low operational intensity, performance is limited by how fast data can be moved from memory.
2. **Compute Bound (Horizontal Line):** A red dashed line representing a peak performance of **312 TFLOP/s**. This is the absolute ceiling for the hardware regardless of operational intensity.
3. **Ridge Point:** A vertical green dashed line marks the intersection of the bandwidth and compute limits, occurring at approximately **161 FLOP/Byte**.
---
## 4. Data Series Analysis and Trends
### Memory-Bound Operations (Low Operational Intensity)
These data points follow the sloped blue line or sit significantly below it at the left side of the chart.
* **qk/pv ar (Brown 'x'):**
* **Trend:** Vertical cluster at Operational Intensity ≈ 1.
* **Performance:** Ranges from ~50G FLOP/s to ~1.5T FLOP/s.
* **Observation:** These are highly memory-bound operations with very low arithmetic intensity.
* **qkv mlp ar (Orange 'x'):**
* **Trend:** Slopes upward following the memory bandwidth limit.
* **Performance:** Starts at ~1.2T FLOP/s (OI ≈ 2) and reaches ~20T FLOP/s (OI ≈ 30).
* **up/gate/down ar (Red 'x'):**
* **Trend:** Slopes upward, slightly higher performance than 'qkv mlp ar' for similar intensities.
* **Performance:** Starts at ~2T FLOP/s (OI ≈ 2) and reaches ~35T FLOP/s (OI ≈ 30).
### Transition and Compute-Bound Operations (High Operational Intensity)
These data points cluster near the horizontal red line at the right side of the chart.
* **qk/pv init (Purple 'x'):**
* **Trend:** Slopes upward from OI ≈ 40 to OI ≈ 120.
* **Performance:** Starts at ~6T FLOP/s and reaches ~120T FLOP/s.
* **qkv mlp init (Blue 'x'):**
* **Trend:** Clustered near the ridge point and beyond (OI ≈ 200 to 3k).
* **Performance:** High performance, ranging from ~150T FLOP/s to ~250T FLOP/s.
* **up/gate/down init (Green 'x'):**
* **Trend:** Clustered at the highest operational intensities (OI ≈ 200 to 4k).
* **Performance:** These are the most efficient operations, consistently hitting the peak compute limit at ~250T - 300T FLOP/s.
---
## 5. Summary of Findings
* **Initialization vs. Autoregressive:** "Init" (Initialization) phases consistently show higher operational intensity and higher performance (closer to the 312 TFLOP/s peak) compared to "ar" (Autoregressive) phases.
* **Bottlenecks:** Autoregressive operations (ar) are severely memory-bound, limited by the 1,935 GB/s bandwidth. Initialization operations (init) are compute-bound or near-compute-bound, utilizing the A100's processing power more effectively.
* **Efficiency:** The "up/gate/down init" operations are the most efficient kernels in this workload, achieving performance closest to the theoretical hardware maximum.