# Technical Document Extraction: Roofline Model Analysis
## Chart Title
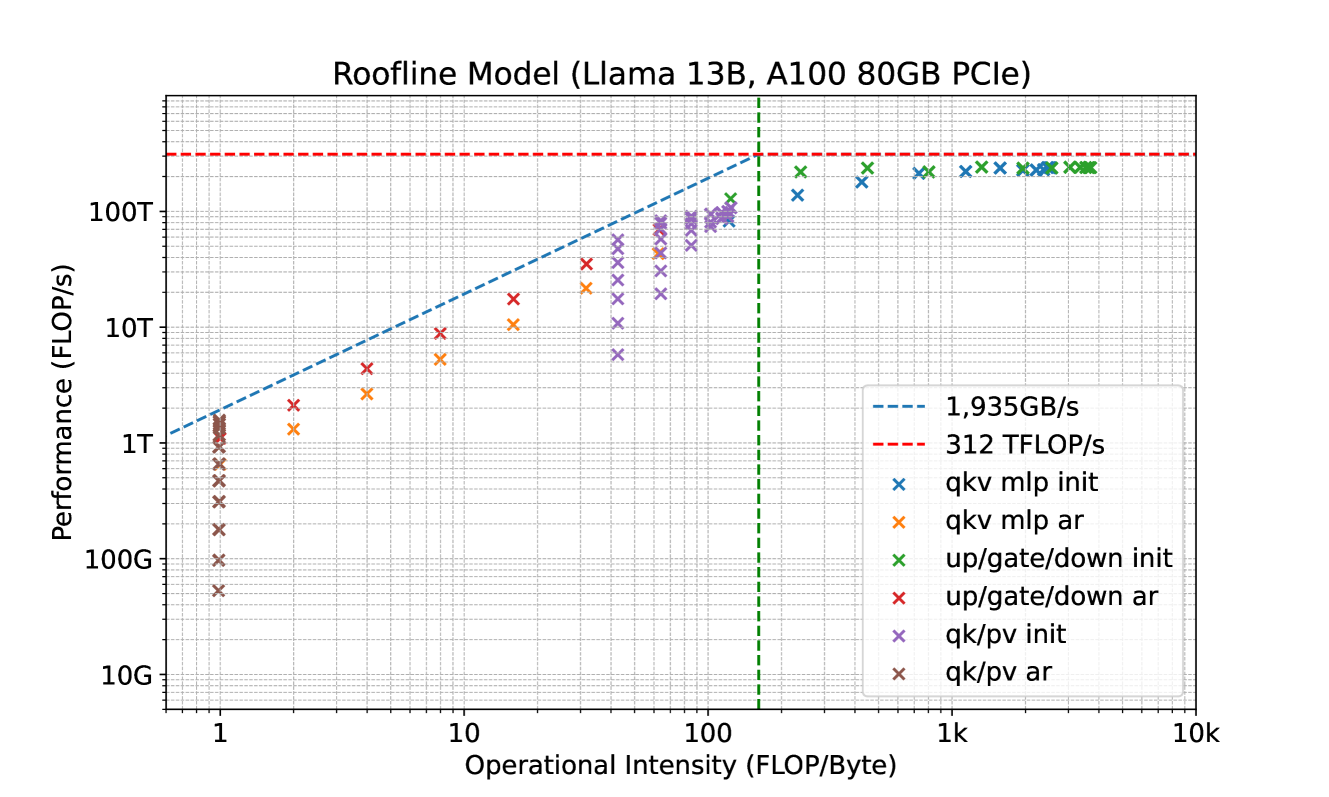
**Roofline Model (Llama 13B, A100 80GB PCIe)**
## Axes Labels
- **X-Axis**: Operational Intensity (FLOP/Byte)
- Range: 1 to 10,000 (logarithmic scale)
- Key marker: Green dashed vertical line at 100 FLOP/Byte
- **Y-Axis**: Performance (FLOP/s)
- Range: 10G to 100T (logarithmic scale)
- Key markers:
- Blue dashed line labeled "1,935GB/s"
- Red dashed line labeled "312 TFLOP/s"
## Legend Entries
| Label | Color | Marker | Description |
|----------------------|--------|--------|----------------------|
| qkv mlp init | Blue | X | Initial qkv mlp |
| qkv mlp ar | Orange | X | qkv mlp activation |
| up/gate/down init | Green | X | Initial up/gate/down |
| up/gate/down ar | Red | X | up/gate/down activation |
| qk/pv init | Purple | X | Initial qk/pv |
| qk/pv ar | Brown | X | qk/pv activation |
## Key Trends
1. **Performance Scaling**:
- Data points cluster along the blue dashed line ("1,935GB/s"), indicating memory-bound operations dominate performance at lower operational intensities.
- Beyond the green dashed line (100 FLOP/Byte), performance aligns with the red dashed line ("312 TFLOP/s"), suggesting compute-bound operations dominate.
2. **Operational Intensity Threshold**:
- The green dashed line at 100 FLOP/Byte demarcates the transition from memory-bound to compute-bound performance regimes.
3. **Data Series Behavior**:
- All series (qkv mlp, up/gate/down, qk/pv) follow similar scaling patterns, with slight variations in performance at specific intensity thresholds.
## Additional Notes
- The chart uses a logarithmic scale for both axes to visualize performance across orders of magnitude.
- The red dashed line ("312 TFLOP/s") represents the theoretical peak performance of the A100 GPU, while the blue dashed line ("1,935GB/s") reflects memory bandwidth constraints.
- Data points are plotted as "X" markers, with colors corresponding to their respective operations (e.g., qkv mlp, up/gate/down).