## Heatmap: Accuracy Matrix for Digit Prediction
### Overview
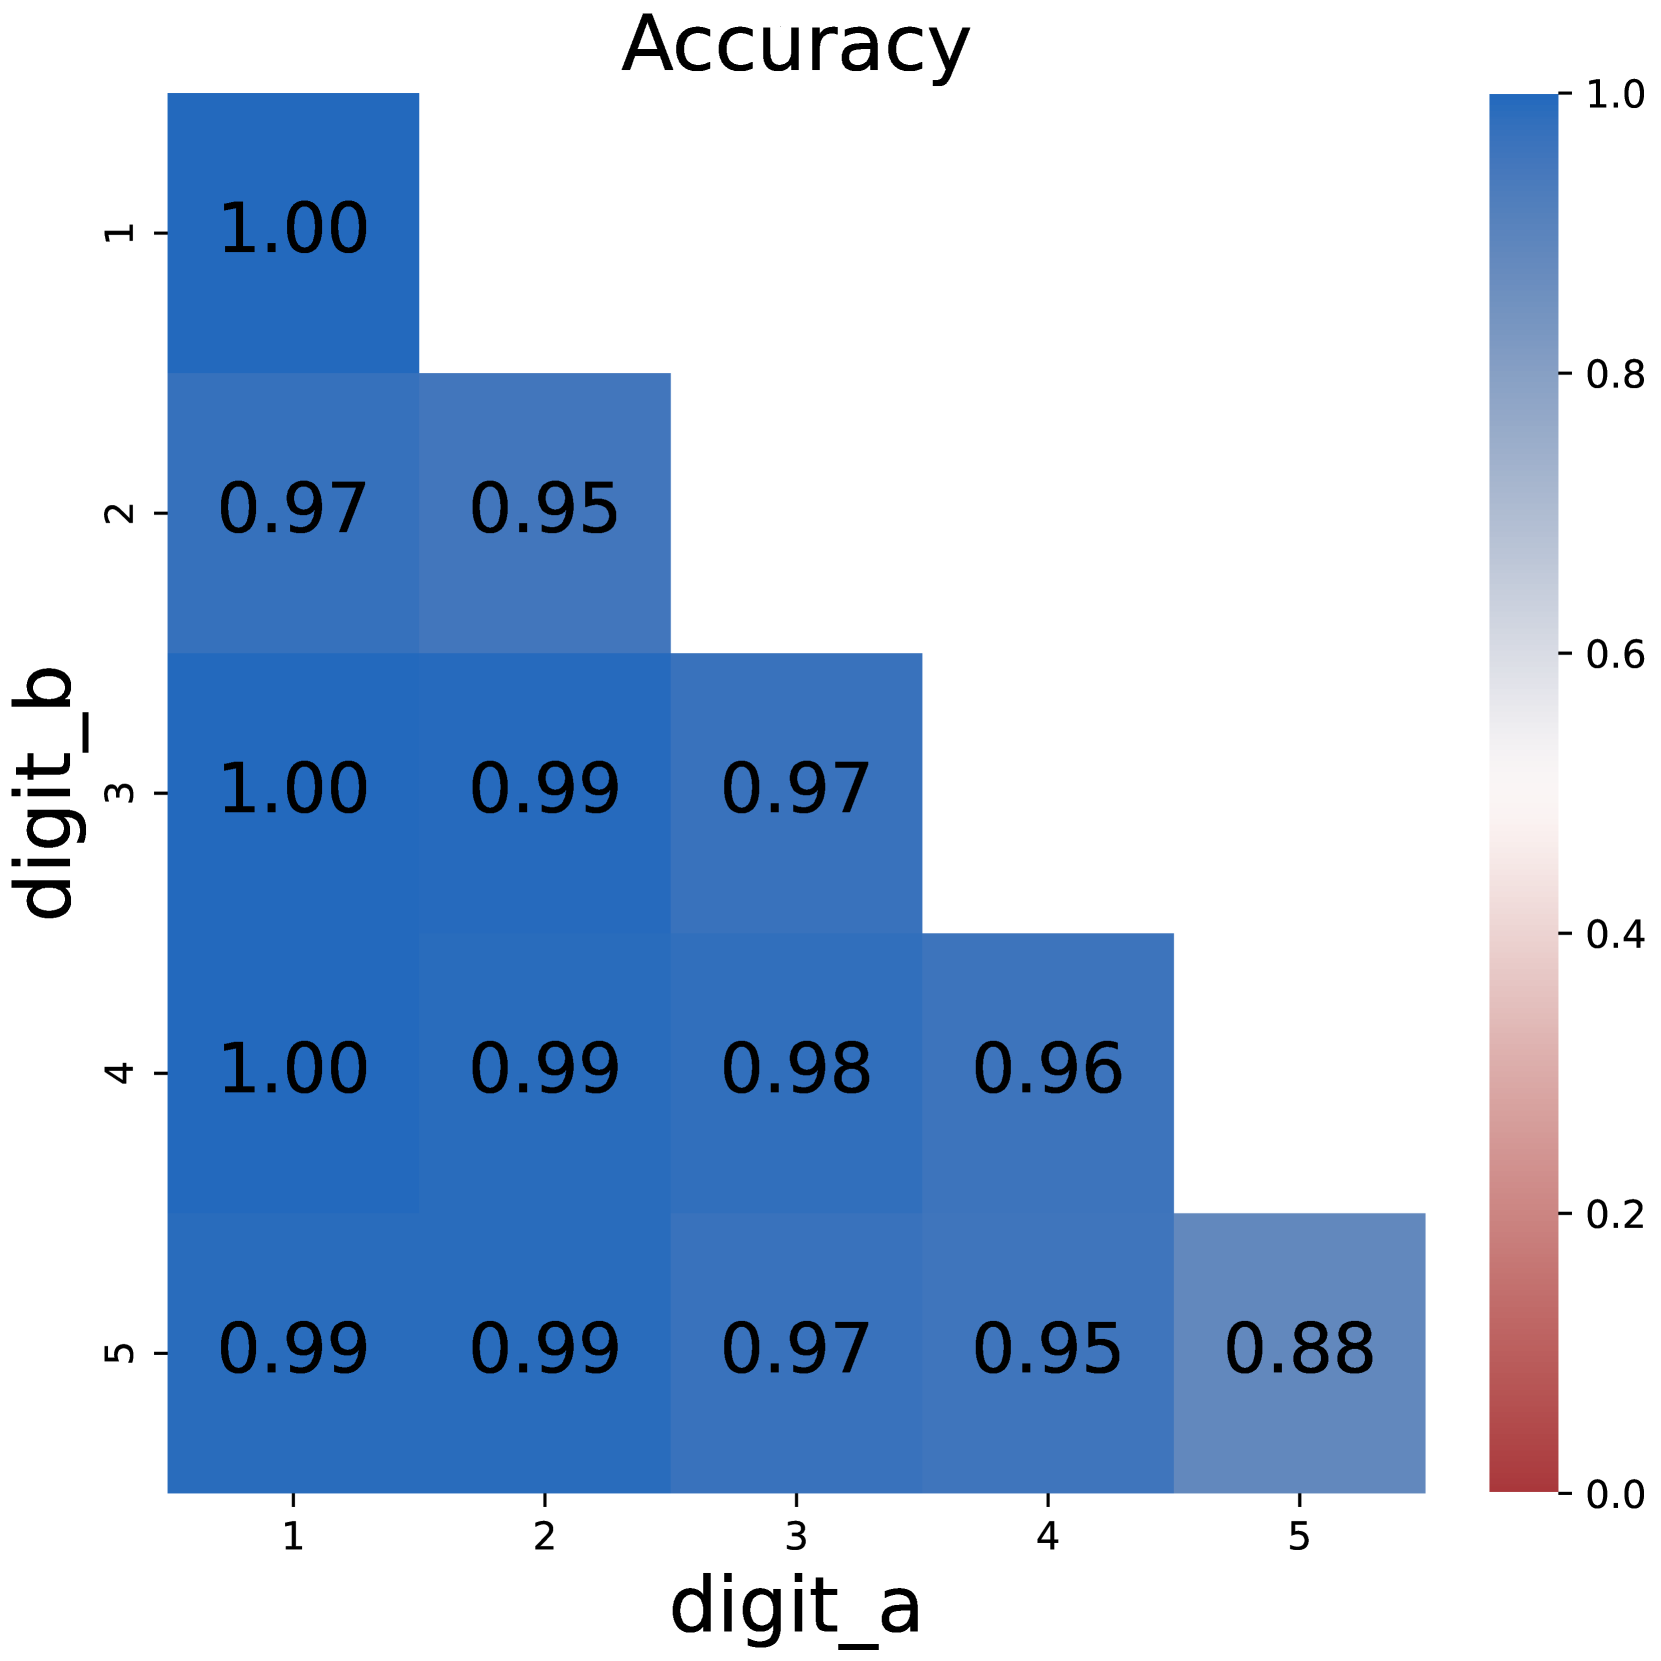
The image displays a square heatmap titled "Accuracy" that visualizes the relationship between two digit prediction variables (`digit_a` and `digit_b`). The matrix uses a blue-to-red color gradient to represent accuracy values ranging from 0.88 to 1.00. Each cell contains a numerical value indicating the accuracy of predicting `digit_b` given `digit_a`.
### Components/Axes
- **X-axis (digit_a)**: Labeled "digit_a" with categories 1–5 (integers).
- **Y-axis (digit_b)**: Labeled "digit_b" with categories 1–5 (integers).
- **Color Legend**: A vertical gradient bar on the right maps values to colors:
- **Dark blue**: High accuracy (1.00).
- **Light blue/white**: Medium accuracy (~0.95).
- **Red**: Low accuracy (0.88).
- **Cell Values**: Numerical accuracy scores embedded in each cell.
### Detailed Analysis
The heatmap reveals the following structure:
```
digit_a \ digit_b | 1 | 2 | 3 | 4 | 5
------------------|-------|-------|-------|-------|-------
1 | 1.00 | 0.97 | 0.99 | 0.99 | 0.99
2 | 0.97 | 0.95 | 0.97 | 0.98 | 0.96
3 | 0.99 | 0.97 | 1.00 | 0.97 | 0.95
4 | 0.99 | 0.98 | 0.97 | 0.96 | 0.95
5 | 0.99 | 0.99 | 0.97 | 0.95 | 0.88
```
- **Diagonal Dominance**: The main diagonal (where `digit_a = digit_b`) contains the highest values (1.00 for most cells, except 0.88 at (5,5)).
- **Symmetry**: The matrix is symmetric along the diagonal, suggesting mutual accuracy between `digit_a` and `digit_b`.
- **Off-Diagonal Trends**: Accuracy decreases as the absolute difference between `digit_a` and `digit_b` increases. For example:
- (1,5) and (5,1): 0.99 (small drop).
- (5,5): 0.88 (notable outlier).
### Key Observations
1. **Perfect Match Accuracy**: All diagonal cells except (5,5) show 1.00 accuracy, indicating perfect prediction when `digit_a = digit_b`.
2. **Digit 5 Anomaly**: The (5,5) cell deviates with 0.88 accuracy, suggesting a systematic error in predicting digit 5.
3. **Gradual Decline**: Accuracy decreases smoothly as the digit difference grows (e.g., (1,2) = 0.97, (1,3) = 0.99, (1,4) = 0.99, (1,5) = 0.99).
4. **Color Consistency**: Darker blue cells align with higher values (e.g., 1.00), while lighter blue/red cells match lower values (e.g., 0.88).
### Interpretation
The heatmap demonstrates that the prediction model performs optimally when `digit_a` and `digit_b` are identical, with near-perfect accuracy. However, the (5,5) cell’s low accuracy (0.88) indicates a potential flaw in handling digit 5, possibly due to data imbalance or feature extraction issues. The symmetry suggests the model treats `digit_a` and `digit_b` interchangeably, but the gradual decline in accuracy for larger digit differences highlights limitations in generalizing across dissimilar digits. This pattern could inform targeted improvements, such as enhancing robustness for edge cases like digit 5 or refining feature representations for dissimilar digit pairs.