## Bar Chart: MUSHRA for the TUT Mono To Binaural Dataset
### Overview
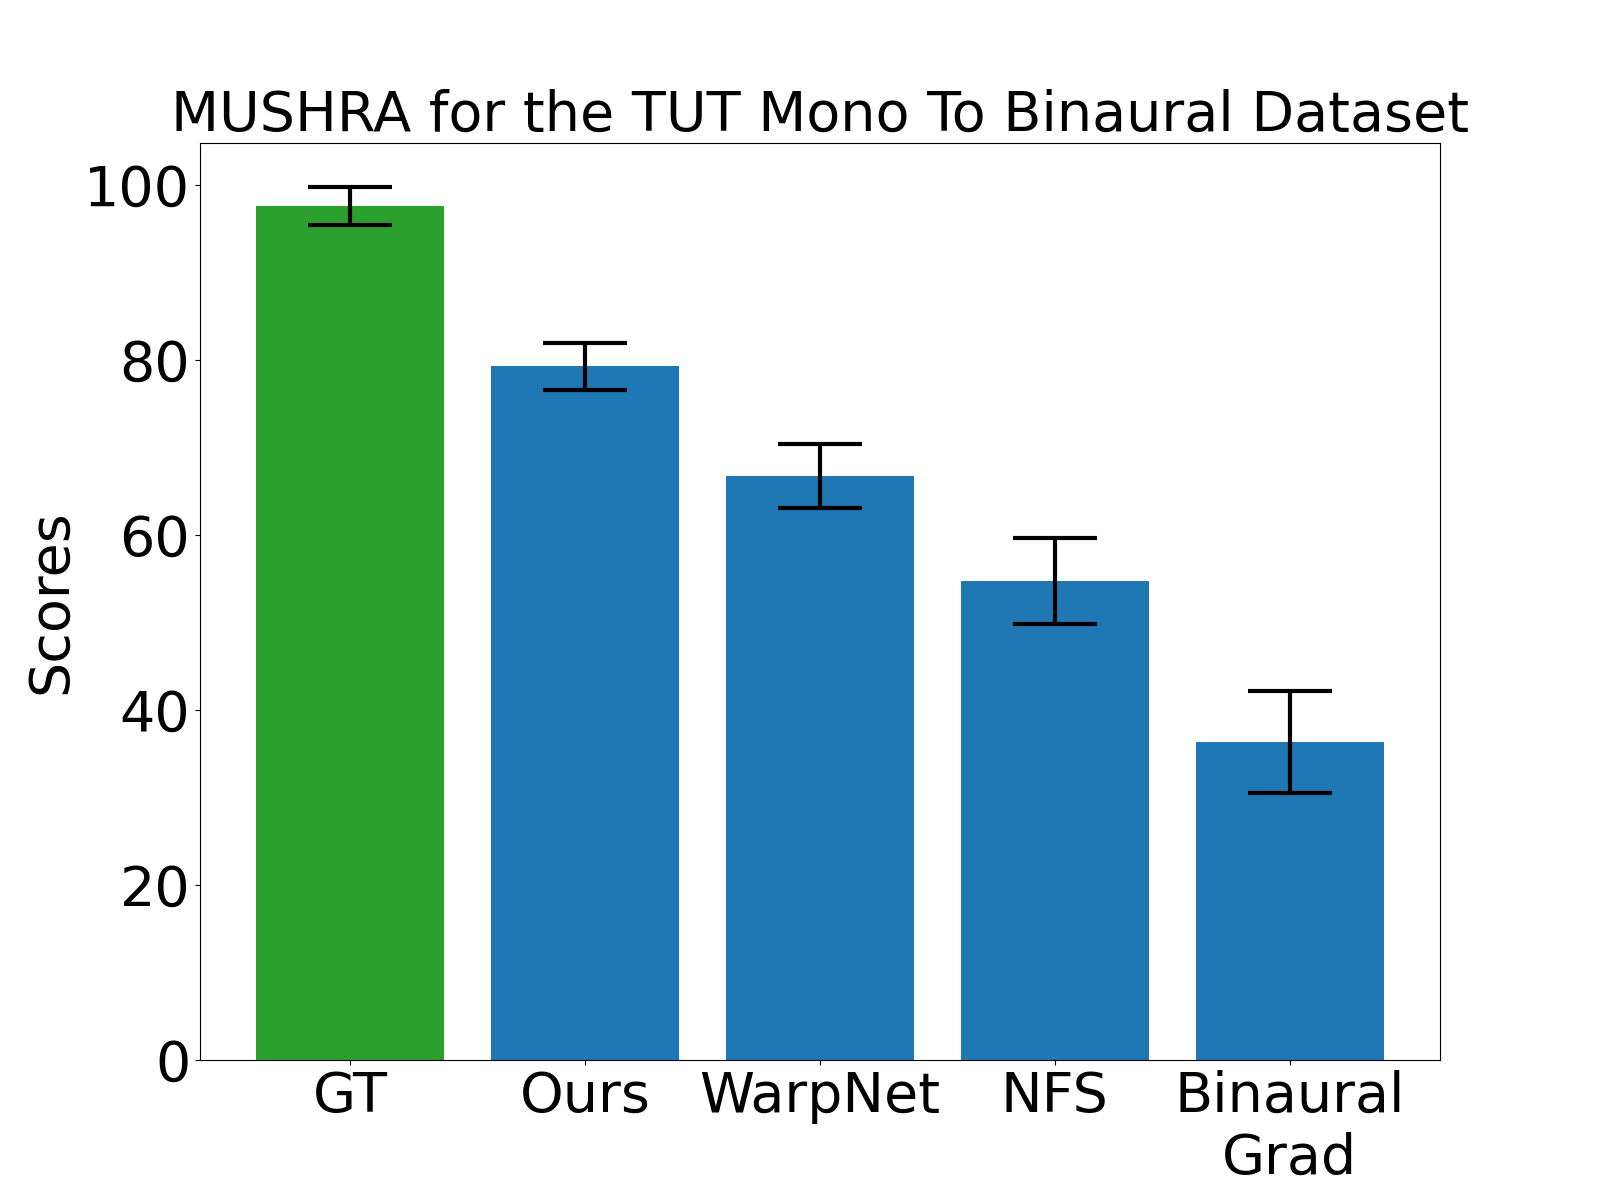
The chart compares scores across five categories: GT (Ground Truth), Ours, WarpNet, NFS, and Binaural Grad. Scores range from 0 to 100, with error bars indicating uncertainty. GT achieves the highest score, while Binaural Grad scores the lowest.
### Components/Axes
- **X-axis**: Categories (GT, Ours, WarpNet, NFS, Binaural Grad)
- **Y-axis**: Scores (0–100)
- **Legend**:
- Green: GT
- Blue: Ours, WarpNet, NFS, Binaural Grad
- **Error Bars**: Vertical lines atop bars representing uncertainty.
### Detailed Analysis
1. **GT (Ground Truth)**:
- Score: ~98 (±2)
- Color: Green
- Error: ±2 (smallest uncertainty)
2. **Ours**:
- Score: ~79 (±3)
- Color: Blue
- Error: ±3
3. **WarpNet**:
- Score: ~67 (±3)
- Color: Blue
- Error: ±3
4. **NFS**:
- Score: ~55 (±4)
- Color: Blue
- Error: ±4
5. **Binaural Grad**:
- Score: ~36 (±4)
- Color: Blue
- Error: ±4 (largest uncertainty)
### Key Observations
- GT dominates with the highest score and smallest error margin.
- Scores decline sequentially: Ours > WarpNet > NFS > Binaural Grad.
- Binaural Grad has the lowest score and highest uncertainty (±4).
- All blue bars (non-GT) show decreasing performance from left to right.
### Interpretation
The data suggests GT is the benchmark for performance, with "Ours" being the closest alternative. WarpNet and NFS follow in descending order, while Binaural Grad underperforms significantly. The larger error margin for Binaural Grad implies greater variability in its results, possibly due to methodological limitations or dataset challenges. The consistent decline in scores highlights the difficulty of replicating GT-level performance in mono-to-binaural tasks. Error bars emphasize the need for robustness testing in lower-performing methods.