\n
## Line Chart: Pass@k vs. k for Different Models
### Overview
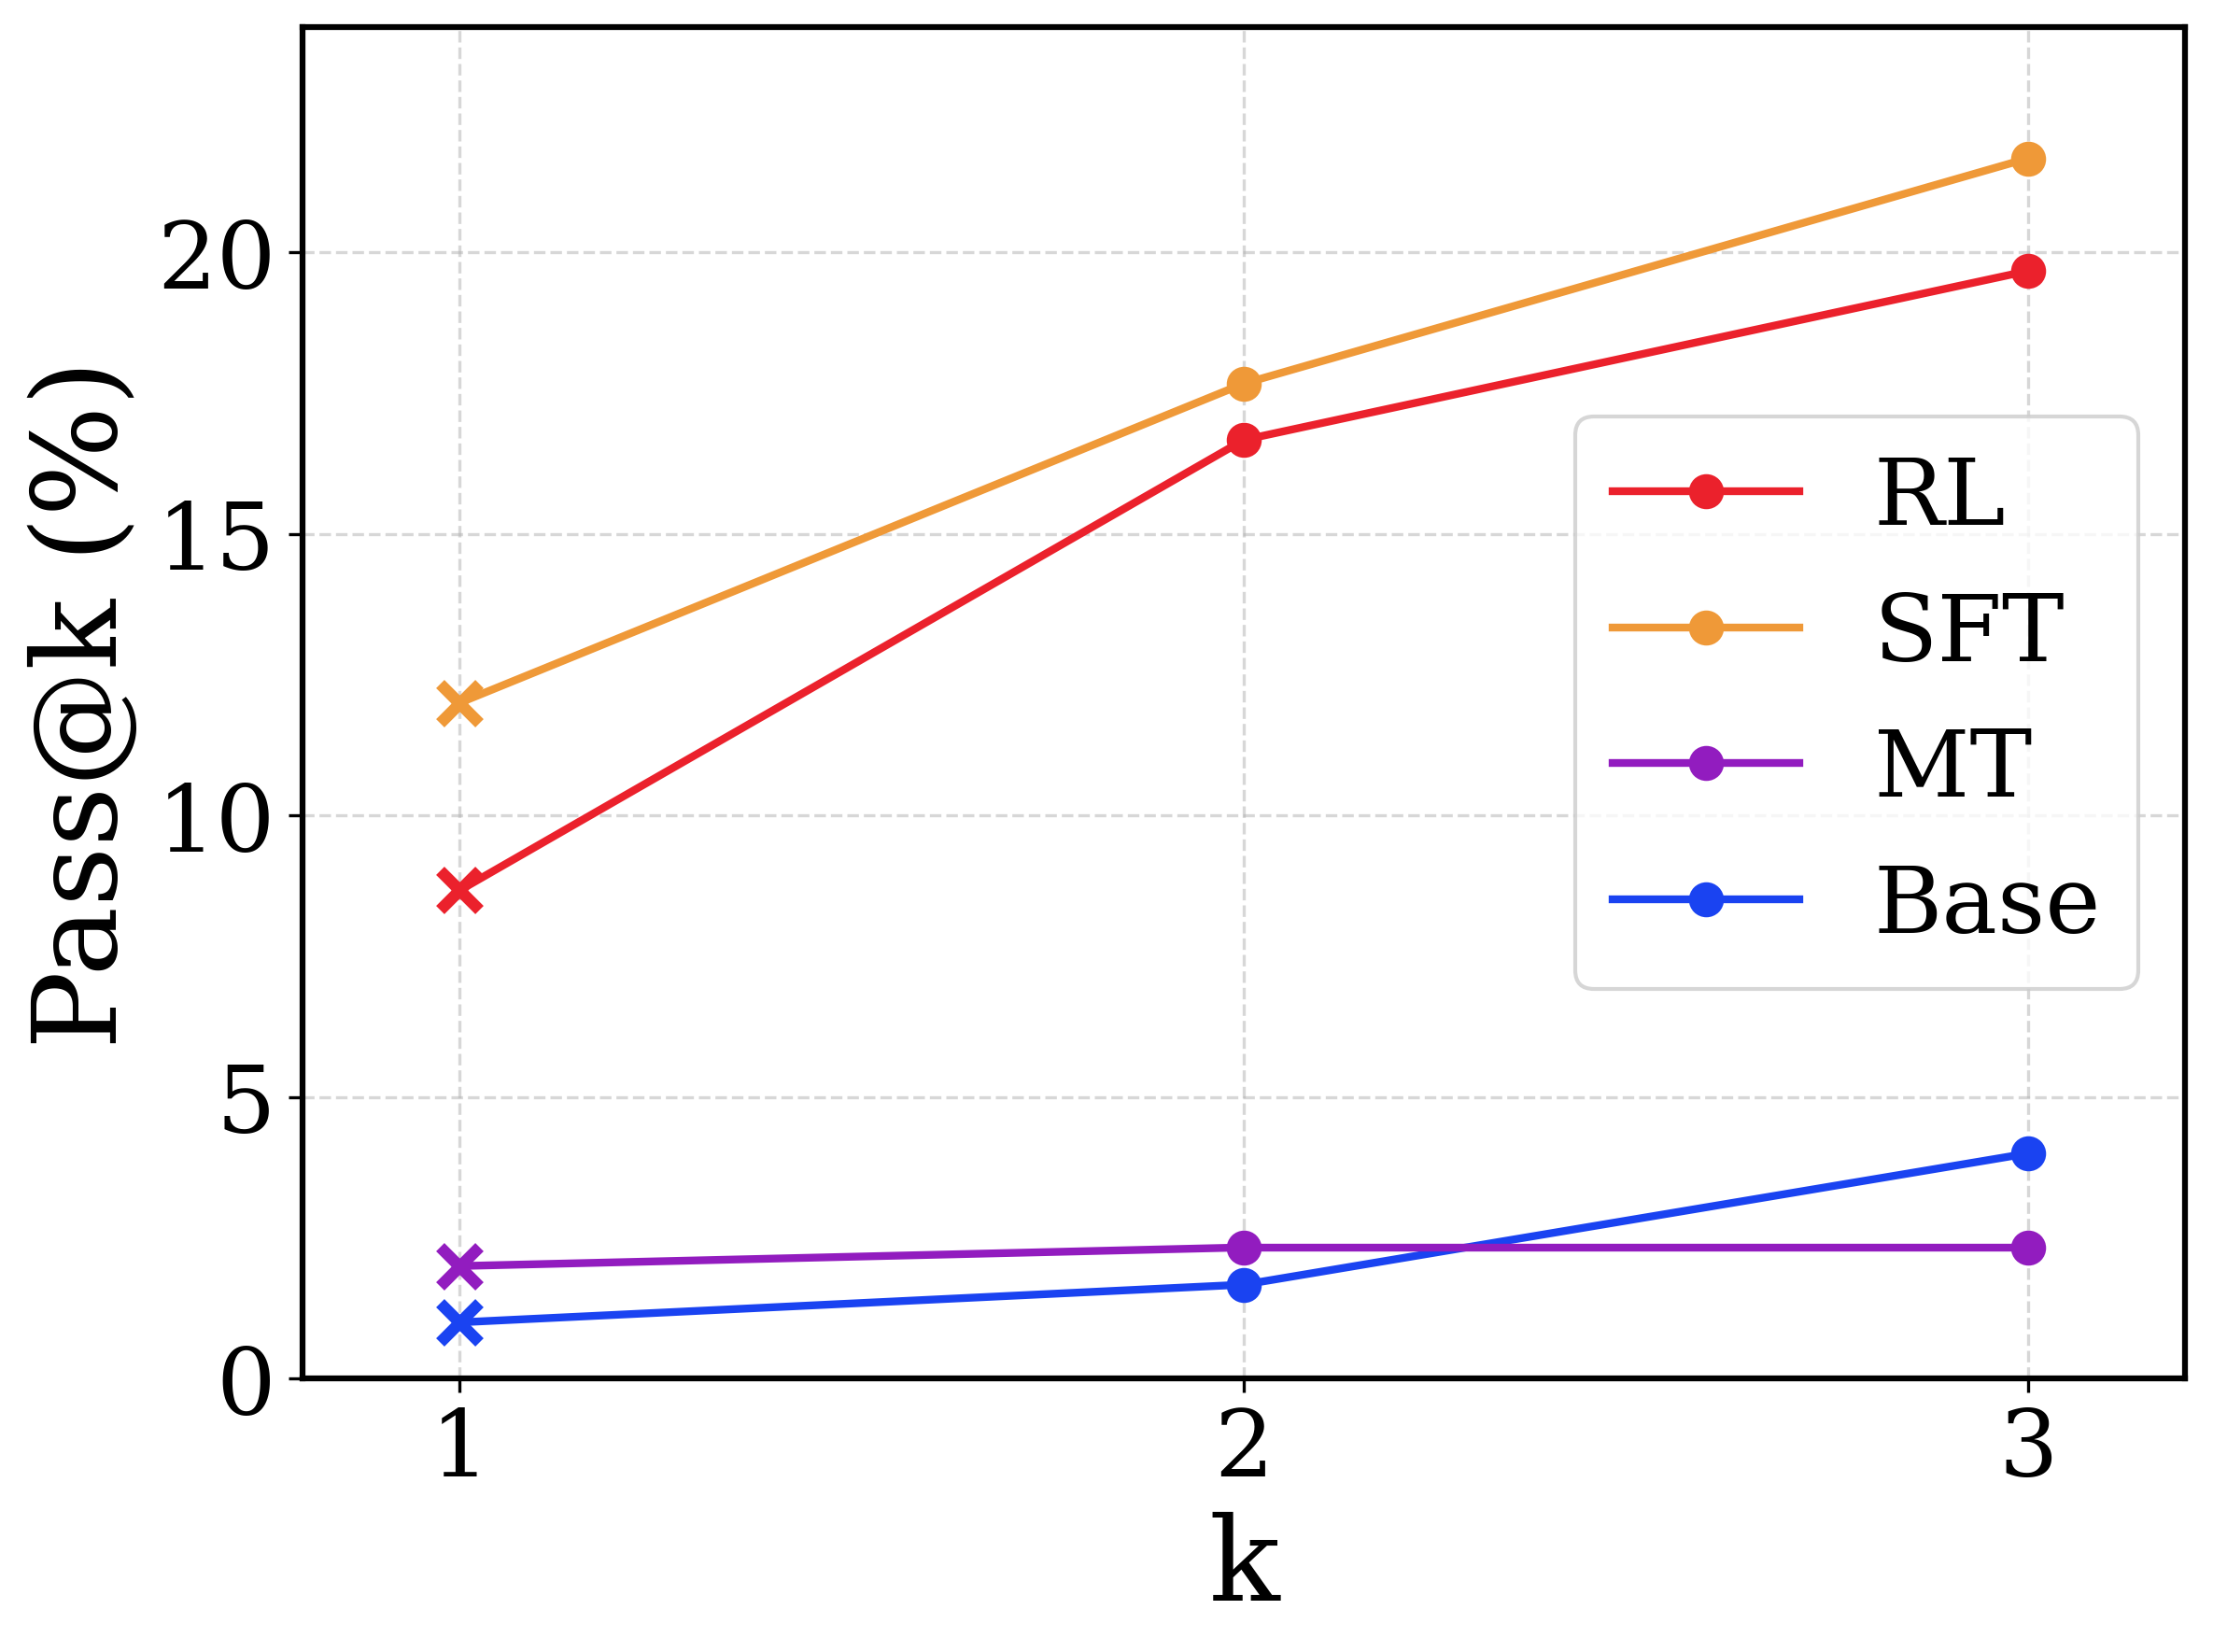
This line chart displays the relationship between the Pass@k metric (in percentage) and the value of 'k' for four different models: RL, SFT, MT, and Base. The chart shows how the Pass@k score changes as 'k' increases from 1 to 3.
### Components/Axes
* **X-axis:** Labeled "k", with values 1, 2, and 3.
* **Y-axis:** Labeled "Pass@k (%)", with a scale ranging from 0 to 20, incrementing by 5.
* **Legend:** Located in the top-right corner, identifying the four data series:
* RL (Red)
* SFT (Orange)
* MT (Purple)
* Base (Blue)
* **Gridlines:** Present to aid in reading values.
### Detailed Analysis
The chart contains four lines, each representing a different model.
* **RL (Red):** The line slopes upward consistently.
* At k=1, Pass@k is approximately 8%.
* At k=2, Pass@k is approximately 17%.
* At k=3, Pass@k is approximately 20%.
* **SFT (Orange):** The line slopes upward consistently, but is above the RL line.
* At k=1, Pass@k is approximately 12%.
* At k=2, Pass@k is approximately 17%.
* At k=3, Pass@k is approximately 20%.
* **MT (Purple):** The line is relatively flat, with a slight upward trend.
* At k=1, Pass@k is approximately 1%.
* At k=2, Pass@k is approximately 2%.
* At k=3, Pass@k is approximately 3%.
* **Base (Blue):** The line is relatively flat, with a slight upward trend.
* At k=1, Pass@k is approximately 1%.
* At k=2, Pass@k is approximately 2%.
* At k=3, Pass@k is approximately 4%.
### Key Observations
* The RL and SFT models show a significant increase in Pass@k as 'k' increases.
* The MT and Base models exhibit minimal improvement in Pass@k with increasing 'k'.
* The SFT model consistently performs slightly better than the RL model.
* The MT and Base models have significantly lower Pass@k scores compared to RL and SFT.
### Interpretation
The data suggests that the RL and SFT models benefit from increasing the value of 'k', indicating that considering more options improves their performance as measured by the Pass@k metric. The Pass@k metric likely represents the probability of a correct answer being within the top 'k' predictions. The flat lines for MT and Base suggest that their performance does not improve significantly with a larger 'k', potentially indicating a limitation in their underlying capabilities or a different mechanism for generating predictions. The consistent outperformance of SFT over RL suggests that the SFT training method is more effective at improving the model's ability to rank correct answers higher in the prediction list. The large gap between RL/SFT and MT/Base indicates a substantial difference in model quality or training methodology. The fact that Pass@k plateaus around 20% for RL and SFT suggests there may be an upper bound on performance achievable with these models, or that the metric is reaching its saturation point.