# Technical Document Extraction: Line Chart Analysis
## Chart Overview
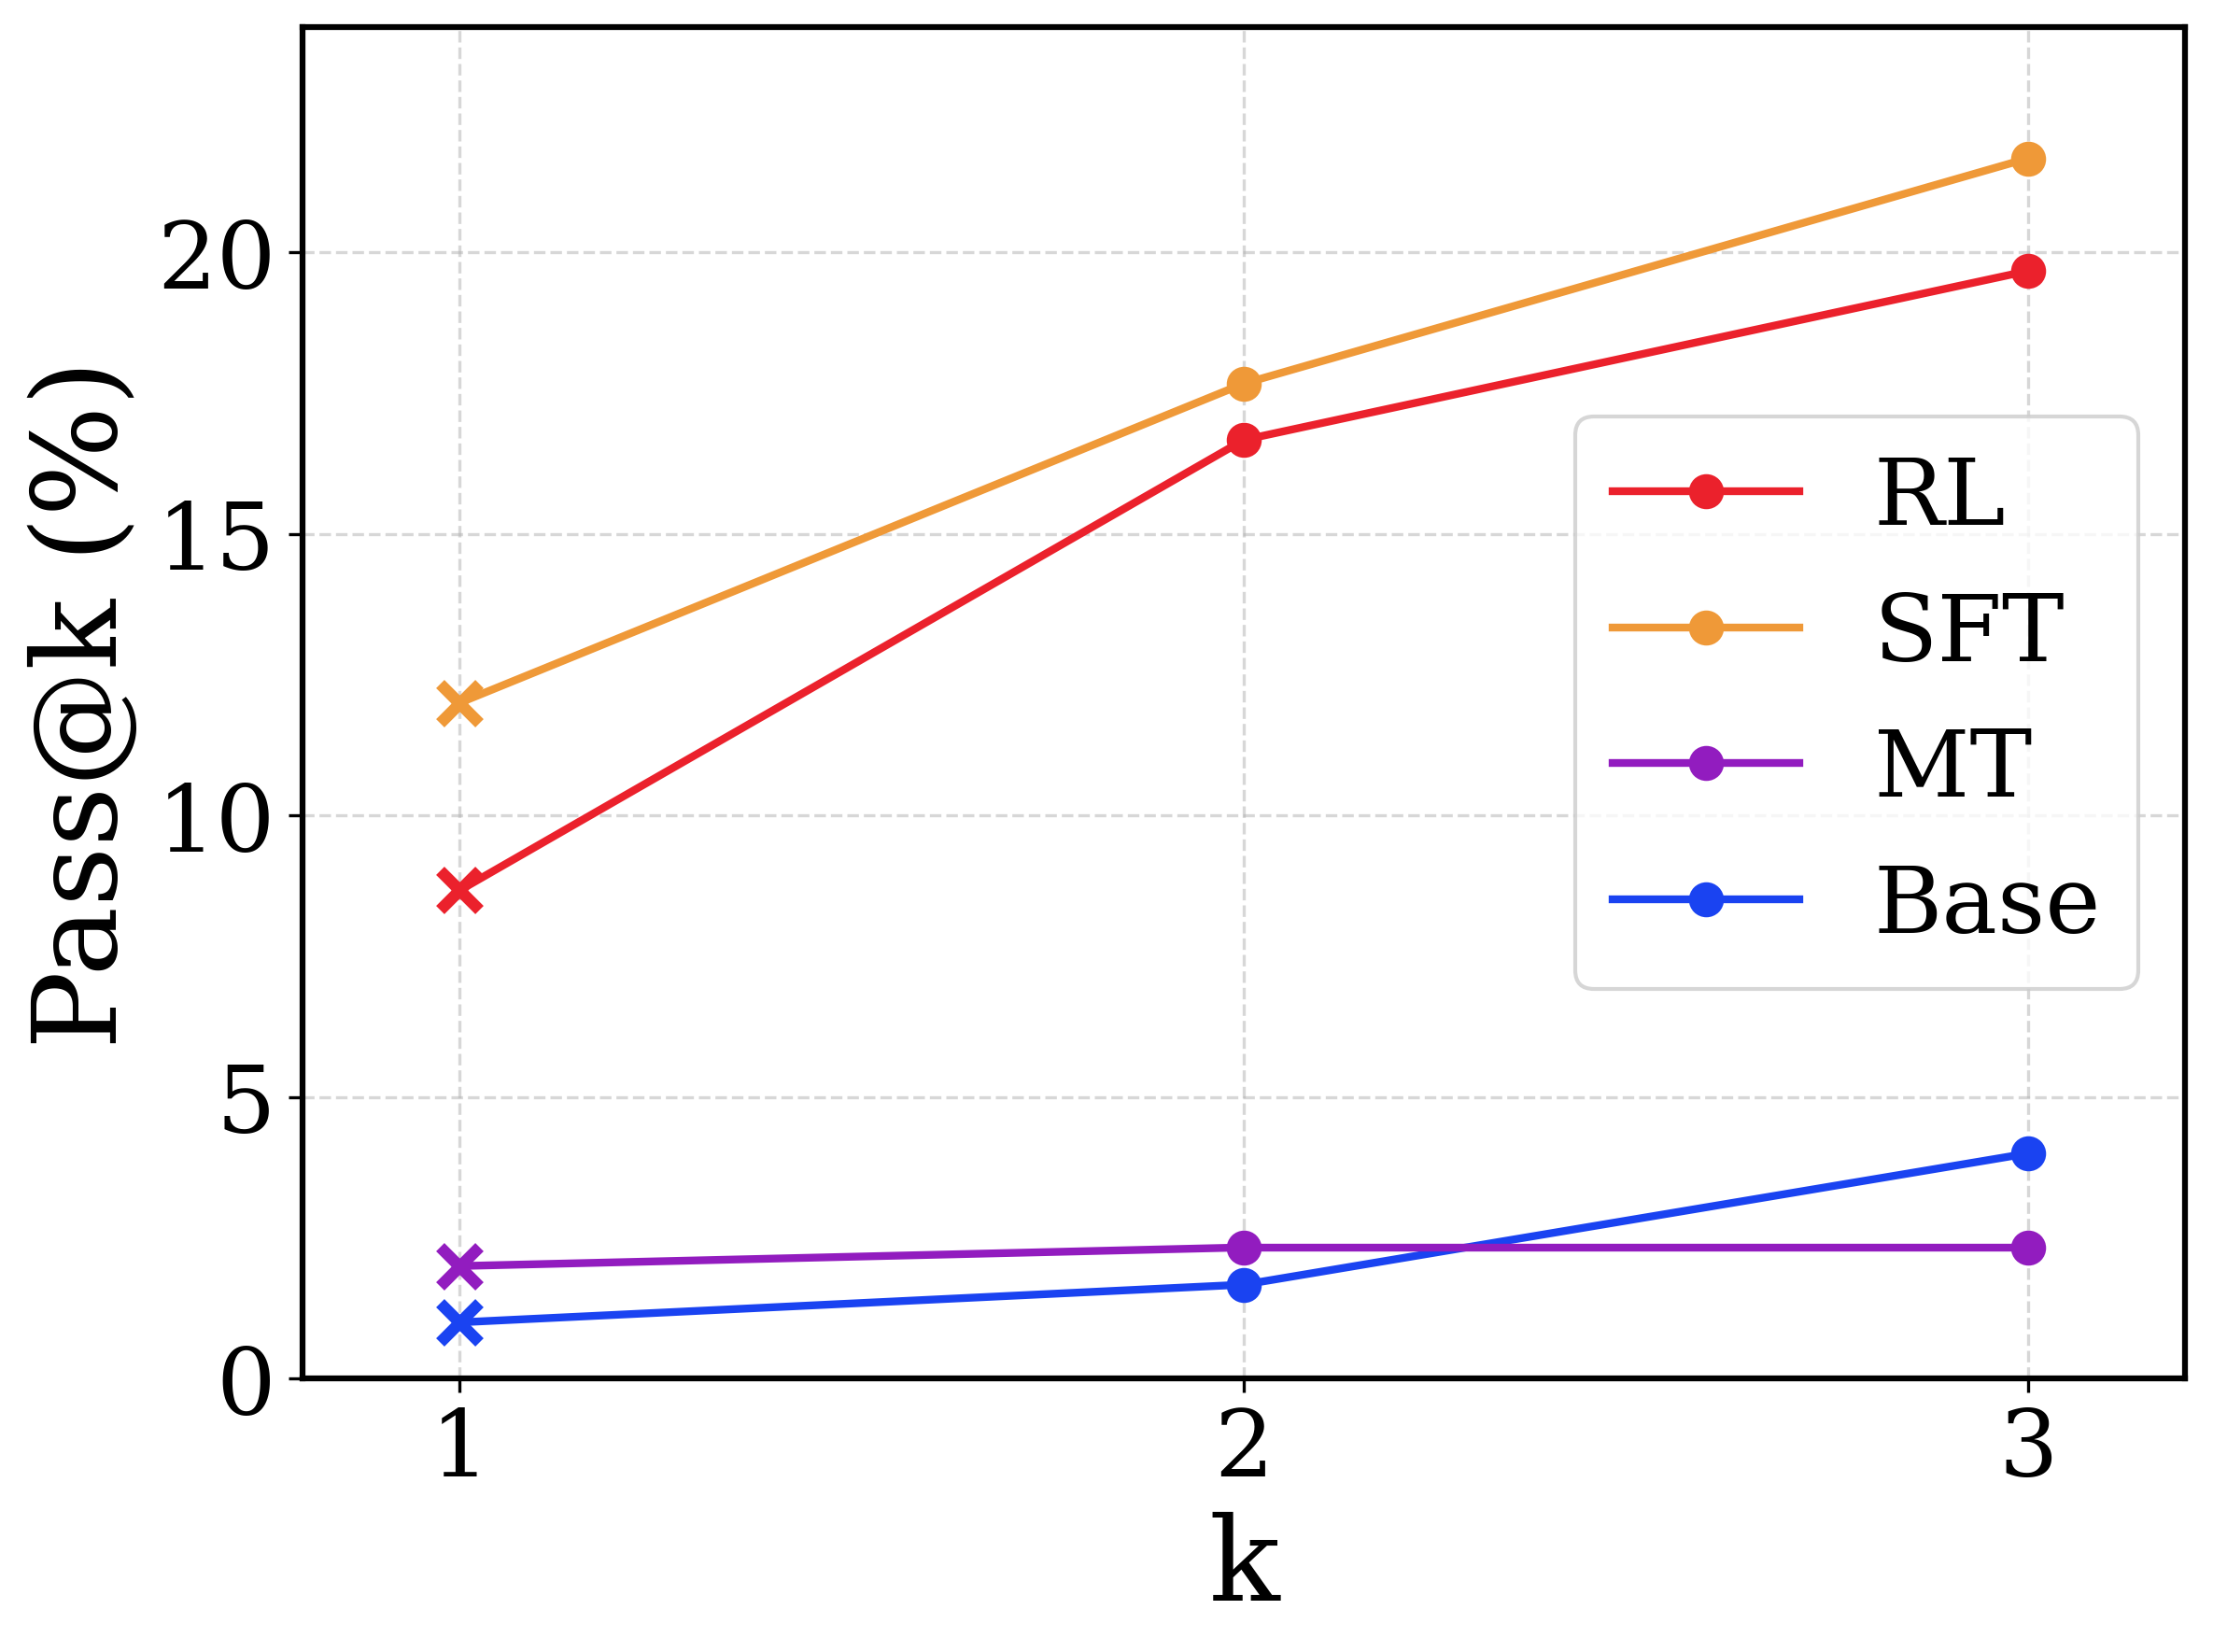
The image depicts a **line chart** visualizing performance metrics across four data series labeled **RL**, **SFT**, **MT**, and **Base**. The chart tracks the metric **Pass@k (%)** against the variable **k** (x-axis). Key components include:
---
### **Axis Labels and Markers**
- **X-axis (Horizontal):**
- Label: `k`
- Tick marks: `1`, `2`, `3`
- Scale: Discrete intervals (no intermediate values).
- **Y-axis (Vertical):**
- Label: `Pass@k (%)`
- Range: `0` to `20` (increments of `5`).
- Tick marks: `0`, `5`, `10`, `15`, `20`.
---
### **Legend and Data Series**
The legend is positioned in the **top-right corner** of the chart. Colors and markers are explicitly mapped as follows:
1. **RL**: Red line with circular markers (`●`).
2. **SFT**: Orange line with square markers (`■`).
3. **MT**: Purple line with circular markers (`●`).
4. **Base**: Blue line with circular markers (`●`).
---
### **Data Trends and Values**
#### **1. RL (Red Line)**
- **Trend**: Steadily increasing.
- **Data Points**:
- `k=1`: ~9%
- `k=2`: ~17%
- `k=3`: ~20%
#### **2. SFT (Orange Line)**
- **Trend**: Steeper upward trajectory than RL.
- **Data Points**:
- `k=1`: ~12%
- `k=2`: ~17.5%
- `k=3`: ~21.5%
#### **3. MT (Purple Line)**
- **Trend**: Flat, minimal growth.
- **Data Points**:
- `k=1`: ~2%
- `k=2`: ~2%
- `k=3`: ~2%
#### **4. Base (Blue Line)**
- **Trend**: Gradual increase.
- **Data Points**:
- `k=1`: ~1%
- `k=2`: ~1.5%
- `k=3`: ~4%
---
### **Spatial Grounding**
- **Legend Placement**: Top-right corner (outside the plot area).
- **Data Point Verification**:
- RL (red) matches red line with circular markers.
- SFT (orange) matches orange line with square markers.
- MT (purple) matches purple line with circular markers.
- Base (blue) matches blue line with circular markers.
---
### **Key Observations**
1. **RL vs. SFT**: Both series show significant growth, but SFT outperforms RL at all `k` values.
2. **MT Stagnation**: MT remains constant across all `k`, suggesting no improvement.
3. **Base Growth**: Base starts lowest but shows the steepest relative increase (from ~1% to ~4%).
---
### **Conclusion**
The chart highlights performance disparities between data series, with SFT leading in Pass@k metrics and MT showing no progress. RL and Base demonstrate moderate improvement, with Base having the highest growth rate.