## Line Charts: Training Reward, Validation Accuracy, and Response Length vs. Step
### Overview
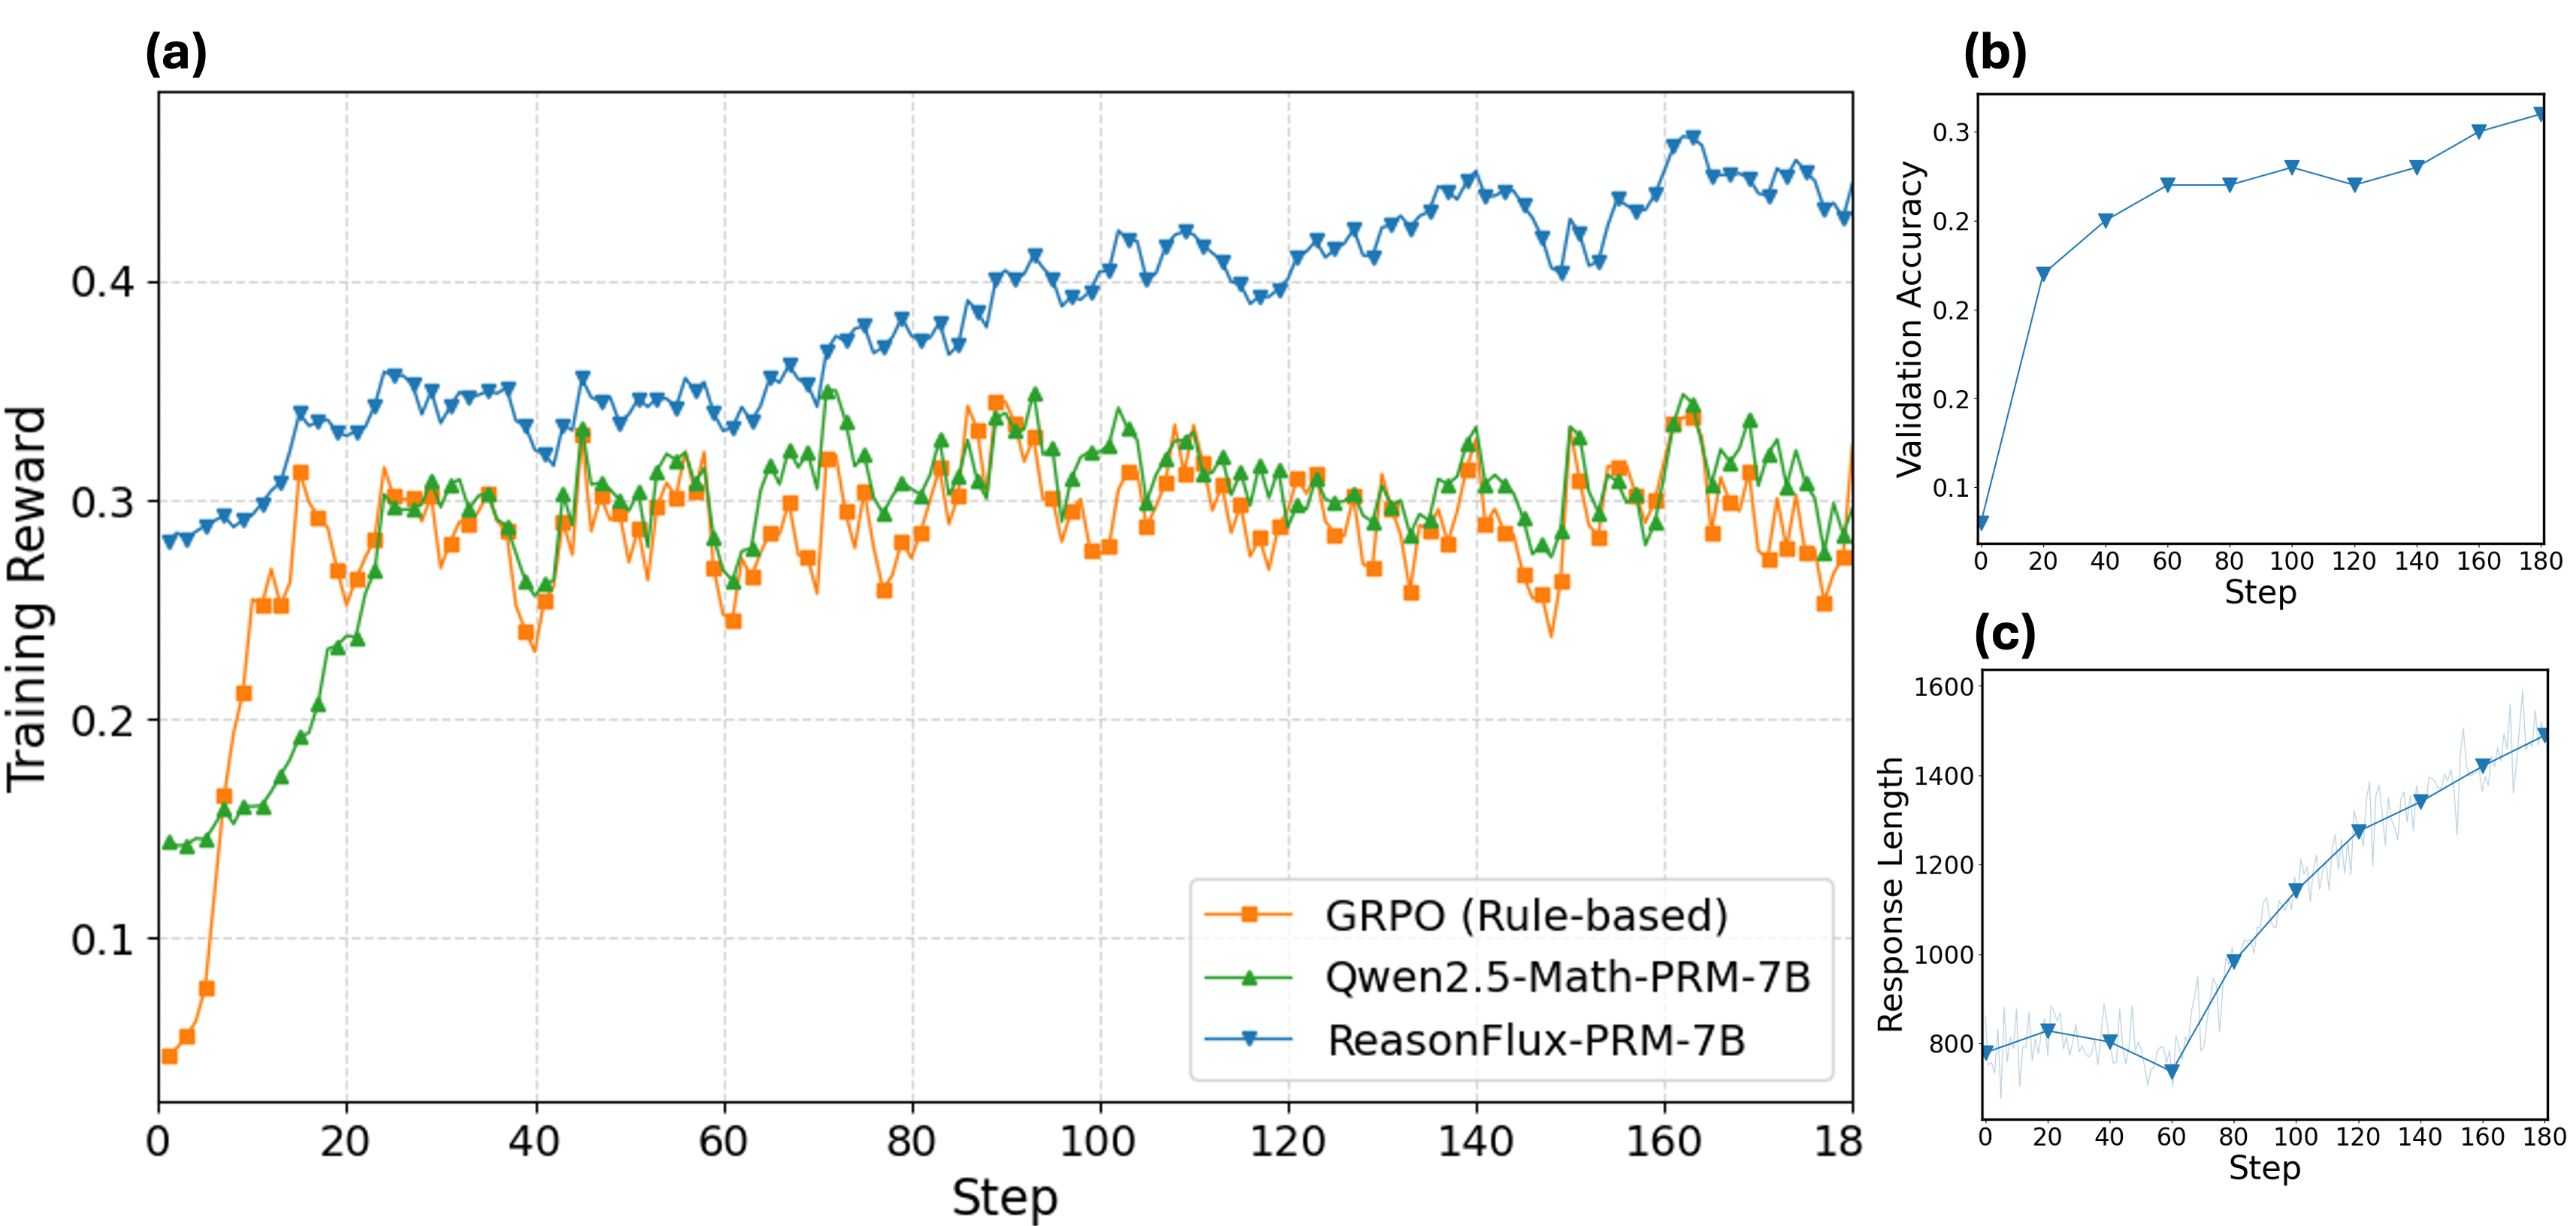
The image presents three line charts, labeled (a), (b), and (c), displaying the performance of different models over a series of steps. Chart (a) compares the training reward of three models: GRPO (Rule-based), Qwen2.5-Math-PRM-7B, and ReasonFlux-PRM-7B. Chart (b) shows the validation accuracy of a model. Chart (c) illustrates the response length of a model.
### Components/Axes
**Chart (a): Training Reward vs. Step**
* **Title:** Training Reward
* **X-axis:** Step, with markers at 0, 20, 40, 60, 80, 100, 120, 140, 160, and 180.
* **Y-axis:** Training Reward, with markers at 0.1, 0.2, 0.3, and 0.4.
* **Legend:** Located in the bottom-right corner.
* Orange squares: GRPO (Rule-based)
* Green triangles: Qwen2.5-Math-PRM-7B
* Blue inverted triangles: ReasonFlux-PRM-7B
**Chart (b): Validation Accuracy vs. Step**
* **Title:** Validation Accuracy
* **X-axis:** Step, with markers at 0, 20, 40, 60, 80, 100, 120, 140, 160, and 180.
* **Y-axis:** Validation Accuracy, with markers at 0.1, 0.2, and 0.3.
* **Data Series:** Blue line with circular markers.
**Chart (c): Response Length vs. Step**
* **Title:** Response Length
* **X-axis:** Step, with markers at 0, 20, 40, 60, 80, 100, 120, 140, 160, and 180.
* **Y-axis:** Response Length, with markers at 800, 1000, 1200, 1400, and 1600.
* **Data Series:** Blue line with inverted triangle markers, surrounded by a lighter blue error range.
### Detailed Analysis
**Chart (a): Training Reward vs. Step**
* **GRPO (Rule-based) - Orange Squares:** The training reward starts at approximately 0.05 at step 0, increases to about 0.3 at step 20, and then fluctuates between 0.25 and 0.32 for the remaining steps.
* **Qwen2.5-Math-PRM-7B - Green Triangles:** The training reward starts at approximately 0.14 at step 0, increases to about 0.3 at step 20, and then fluctuates between 0.25 and 0.35 for the remaining steps.
* **ReasonFlux-PRM-7B - Blue Inverted Triangles:** The training reward starts at approximately 0.28 at step 0, increases to about 0.4 at step 80, and then fluctuates between 0.38 and 0.45 for the remaining steps.
**Chart (b): Validation Accuracy vs. Step**
* The validation accuracy starts at approximately 0.1 at step 0, increases to about 0.24 at step 40, and then fluctuates between 0.24 and 0.3 for the remaining steps.
**Chart (c): Response Length vs. Step**
* The response length starts at approximately 800 at step 0, decreases to about 750 at step 60, and then increases to about 1500 at step 180. The error range increases as the step increases.
### Key Observations
* In chart (a), ReasonFlux-PRM-7B consistently achieves a higher training reward compared to GRPO and Qwen2.5-Math-PRM-7B.
* In chart (b), the validation accuracy plateaus after step 40.
* In chart (c), the response length increases significantly after step 60.
### Interpretation
The charts provide insights into the performance of different models during training. ReasonFlux-PRM-7B appears to be more effective in terms of training reward compared to GRPO and Qwen2.5-Math-PRM-7B. The validation accuracy plateaus, suggesting that the model's ability to generalize to unseen data does not improve significantly after a certain number of steps. The increasing response length indicates that the model generates longer responses as training progresses, which could be a factor in its improved performance. The increasing error range in chart (c) suggests that the variability in response length increases as training progresses.