## Line Charts: Training Performance of Language Models
### Overview
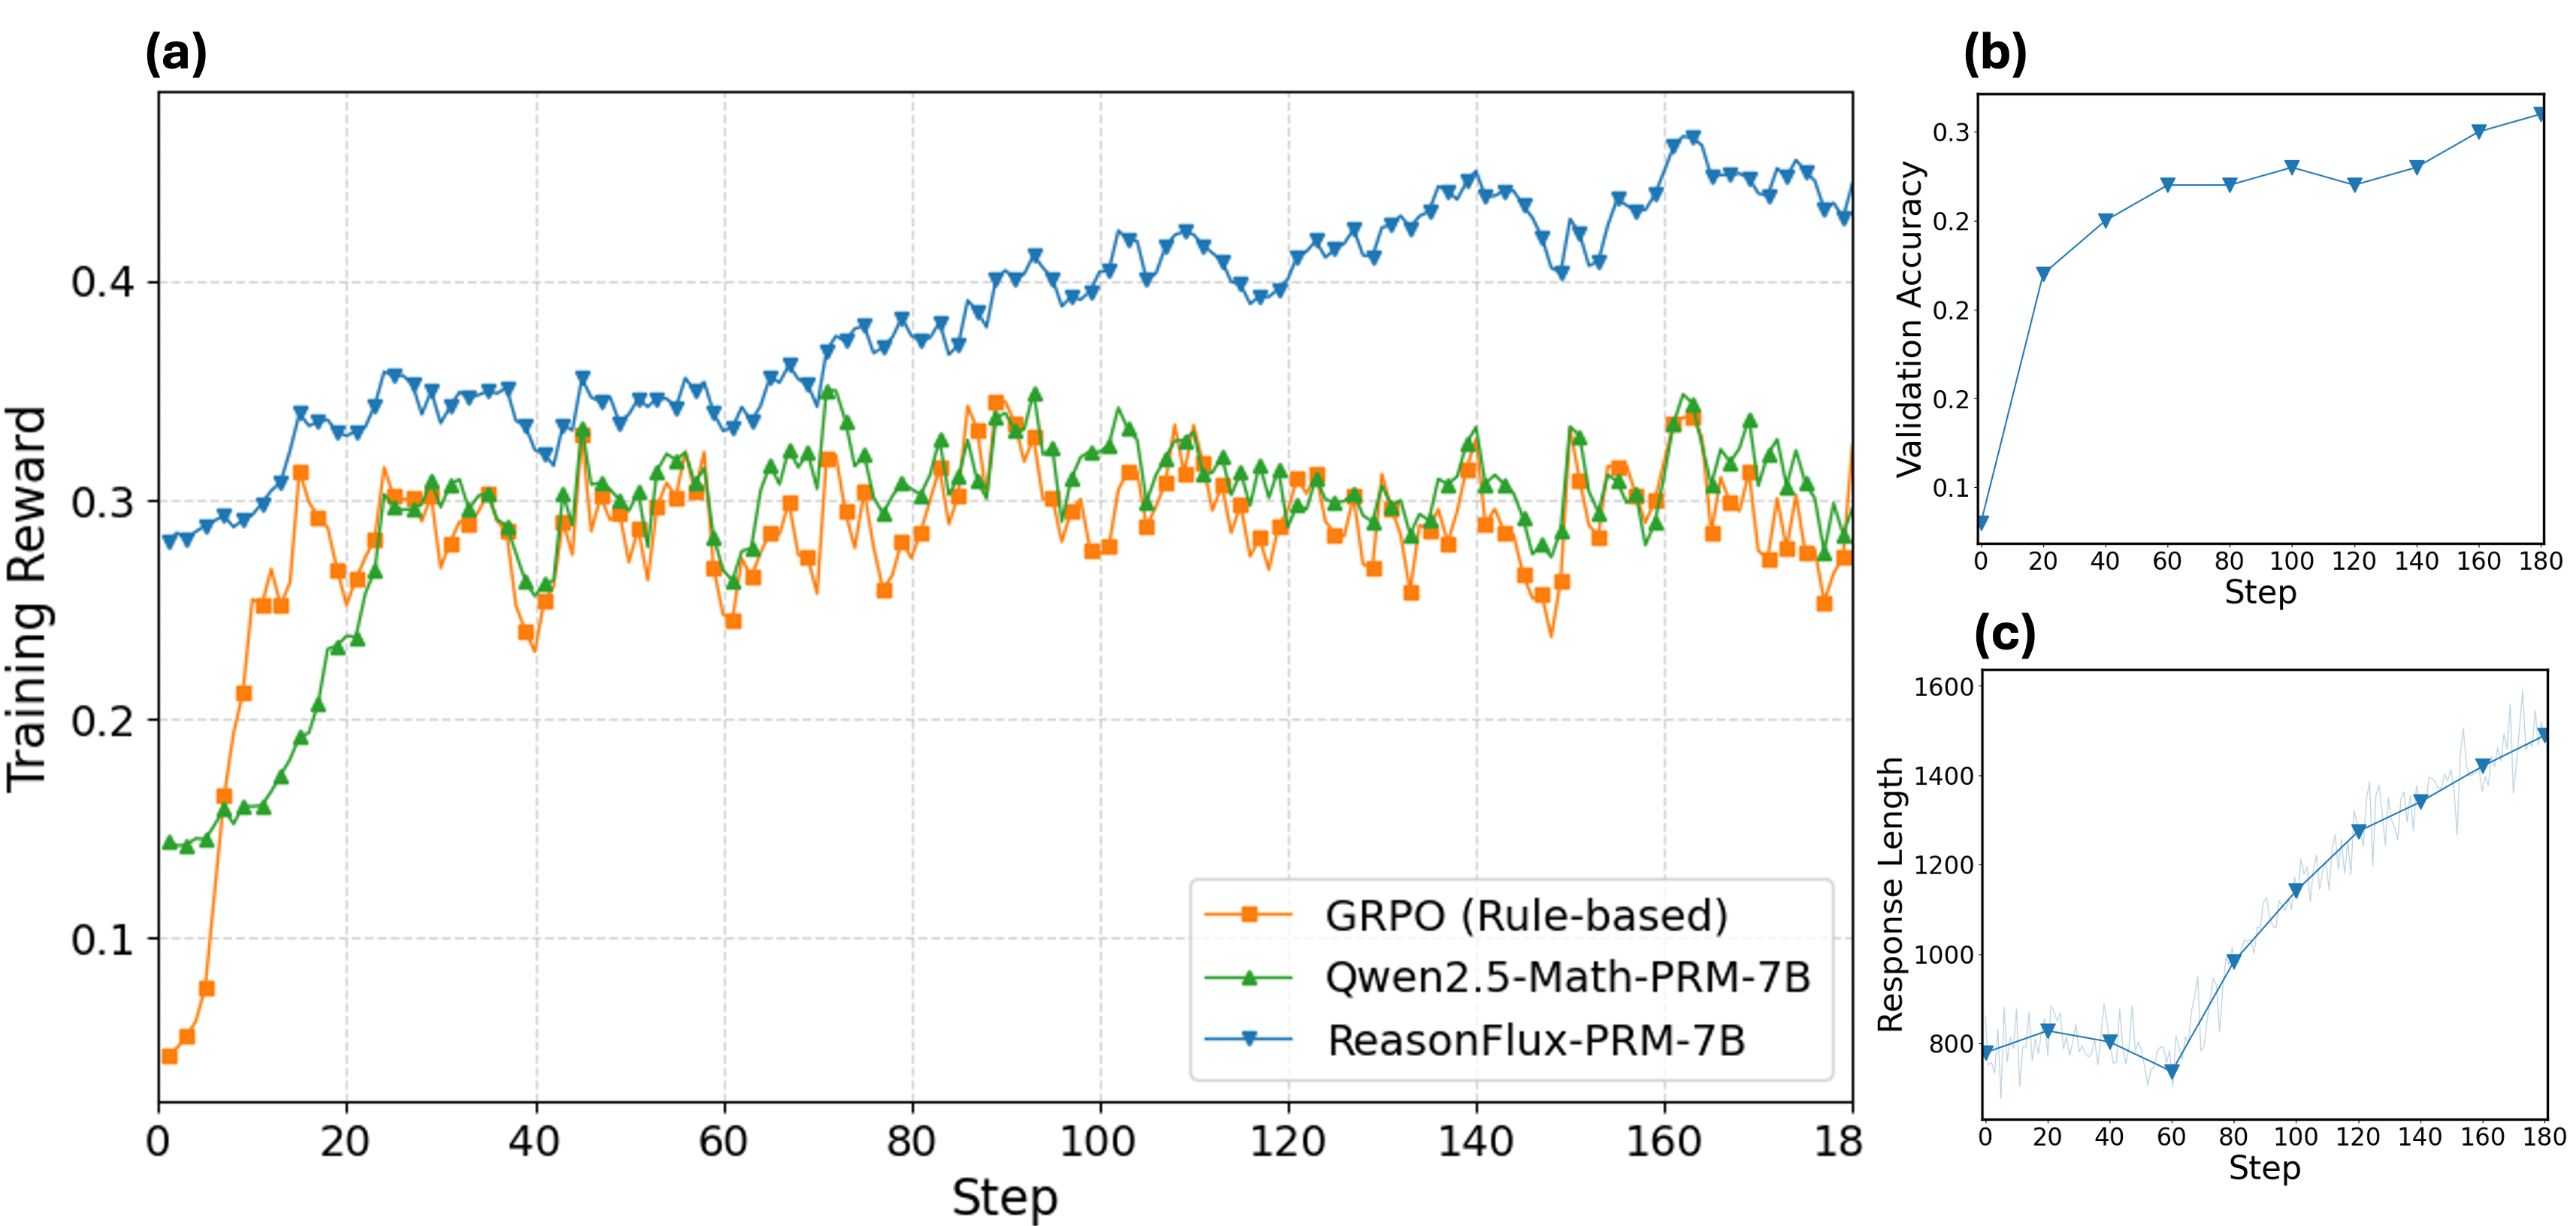
The image presents three line charts (labeled a, b, and c) illustrating the training performance of three different language models: GRPO (Rule-based), Qwen2.5-Math-PRM-7B, and ReasonFlux-7B. Chart (a) shows the training reward over steps, chart (b) shows validation accuracy over steps, and chart (c) shows response length over steps. All charts share a common x-axis representing "Step," ranging from 0 to approximately 180.
### Components/Axes
* **Chart (a): Training Reward vs. Step**
* X-axis: Step (0 to 180, approximately)
* Y-axis: Training Reward (0.1 to 0.45, approximately)
* Data Series:
* GRPO (Rule-based) - Orange
* Qwen2.5-Math-PRM-7B - Green
* ReasonFlux-7B - Blue
* **Chart (b): Validation Accuracy vs. Step**
* X-axis: Step (0 to 180, approximately)
* Y-axis: Validation Accuracy (0 to 0.3, approximately)
* Data Series:
* ReasonFlux-7B - Blue
* **Chart (c): Response Length vs. Step**
* X-axis: Step (0 to 180, approximately)
* Y-axis: Response Length (600 to 1600, approximately)
* Data Series:
* GRPO (Rule-based) - Orange
* Qwen2.5-Math-PRM-7B - Green
* ReasonFlux-7B - Blue
### Detailed Analysis or Content Details
**Chart (a): Training Reward vs. Step**
* **GRPO (Orange):** Starts at approximately 0.28, dips to around 0.12 at step 10, then fluctuates between 0.24 and 0.32 for the remainder of the steps. The line exhibits significant volatility.
* **Qwen2.5-Math-PRM-7B (Green):** Begins at approximately 0.18, rises to around 0.30 by step 20, and then oscillates between 0.25 and 0.35. The line is less volatile than GRPO.
* **ReasonFlux-7B (Blue):** Starts at approximately 0.32, increases steadily to around 0.42 by step 100, then fluctuates between 0.38 and 0.45. This line shows a clear upward trend.
**Chart (b): Validation Accuracy vs. Step**
* **ReasonFlux-7B (Blue):** Starts at approximately 0.24, decreases slightly to around 0.21 at step 20, then increases to approximately 0.28 by step 180. The line is relatively stable.
**Chart (c): Response Length vs. Step**
* **GRPO (Orange):** Starts at approximately 800, increases rapidly to around 1200 by step 40, then plateaus around 1200-1300 for the remainder of the steps.
* **Qwen2.5-Math-PRM-7B (Green):** Begins at approximately 700, increases to around 900 by step 20, then fluctuates between 800 and 1000 before increasing to around 1400 by step 180.
* **ReasonFlux-7B (Blue):** Starts at approximately 750, increases steadily to around 1500 by step 180. This line shows a consistent upward trend.
### Key Observations
* ReasonFlux-7B consistently outperforms GRPO and Qwen2.5-Math-PRM-7B in terms of training reward (Chart a) and exhibits the highest validation accuracy (Chart b).
* GRPO shows the most volatile training reward and a relatively stable response length.
* Qwen2.5-Math-PRM-7B demonstrates moderate performance across all metrics.
* Response length increases over time for all models, with ReasonFlux-7B showing the most significant increase.
### Interpretation
The data suggests that ReasonFlux-7B is the most effective model among the three tested, achieving higher training rewards and validation accuracy. The increasing response length across all models indicates that they are learning to generate more complex outputs as training progresses. The volatility of GRPO's training reward might indicate instability in its learning process. The consistent upward trend in ReasonFlux-7B's training reward and response length suggests a stable and effective learning process. The validation accuracy of ReasonFlux-7B, while increasing, remains relatively low (around 0.28), indicating potential for further improvement. The differences in performance between the models could be attributed to variations in their architectures, training data, or hyperparameters. The charts provide a quantitative assessment of the models' learning dynamics and highlight the strengths and weaknesses of each approach.