## [Composite Line Charts]: Training/Validation Metrics and Response Length for AI Models
### Overview
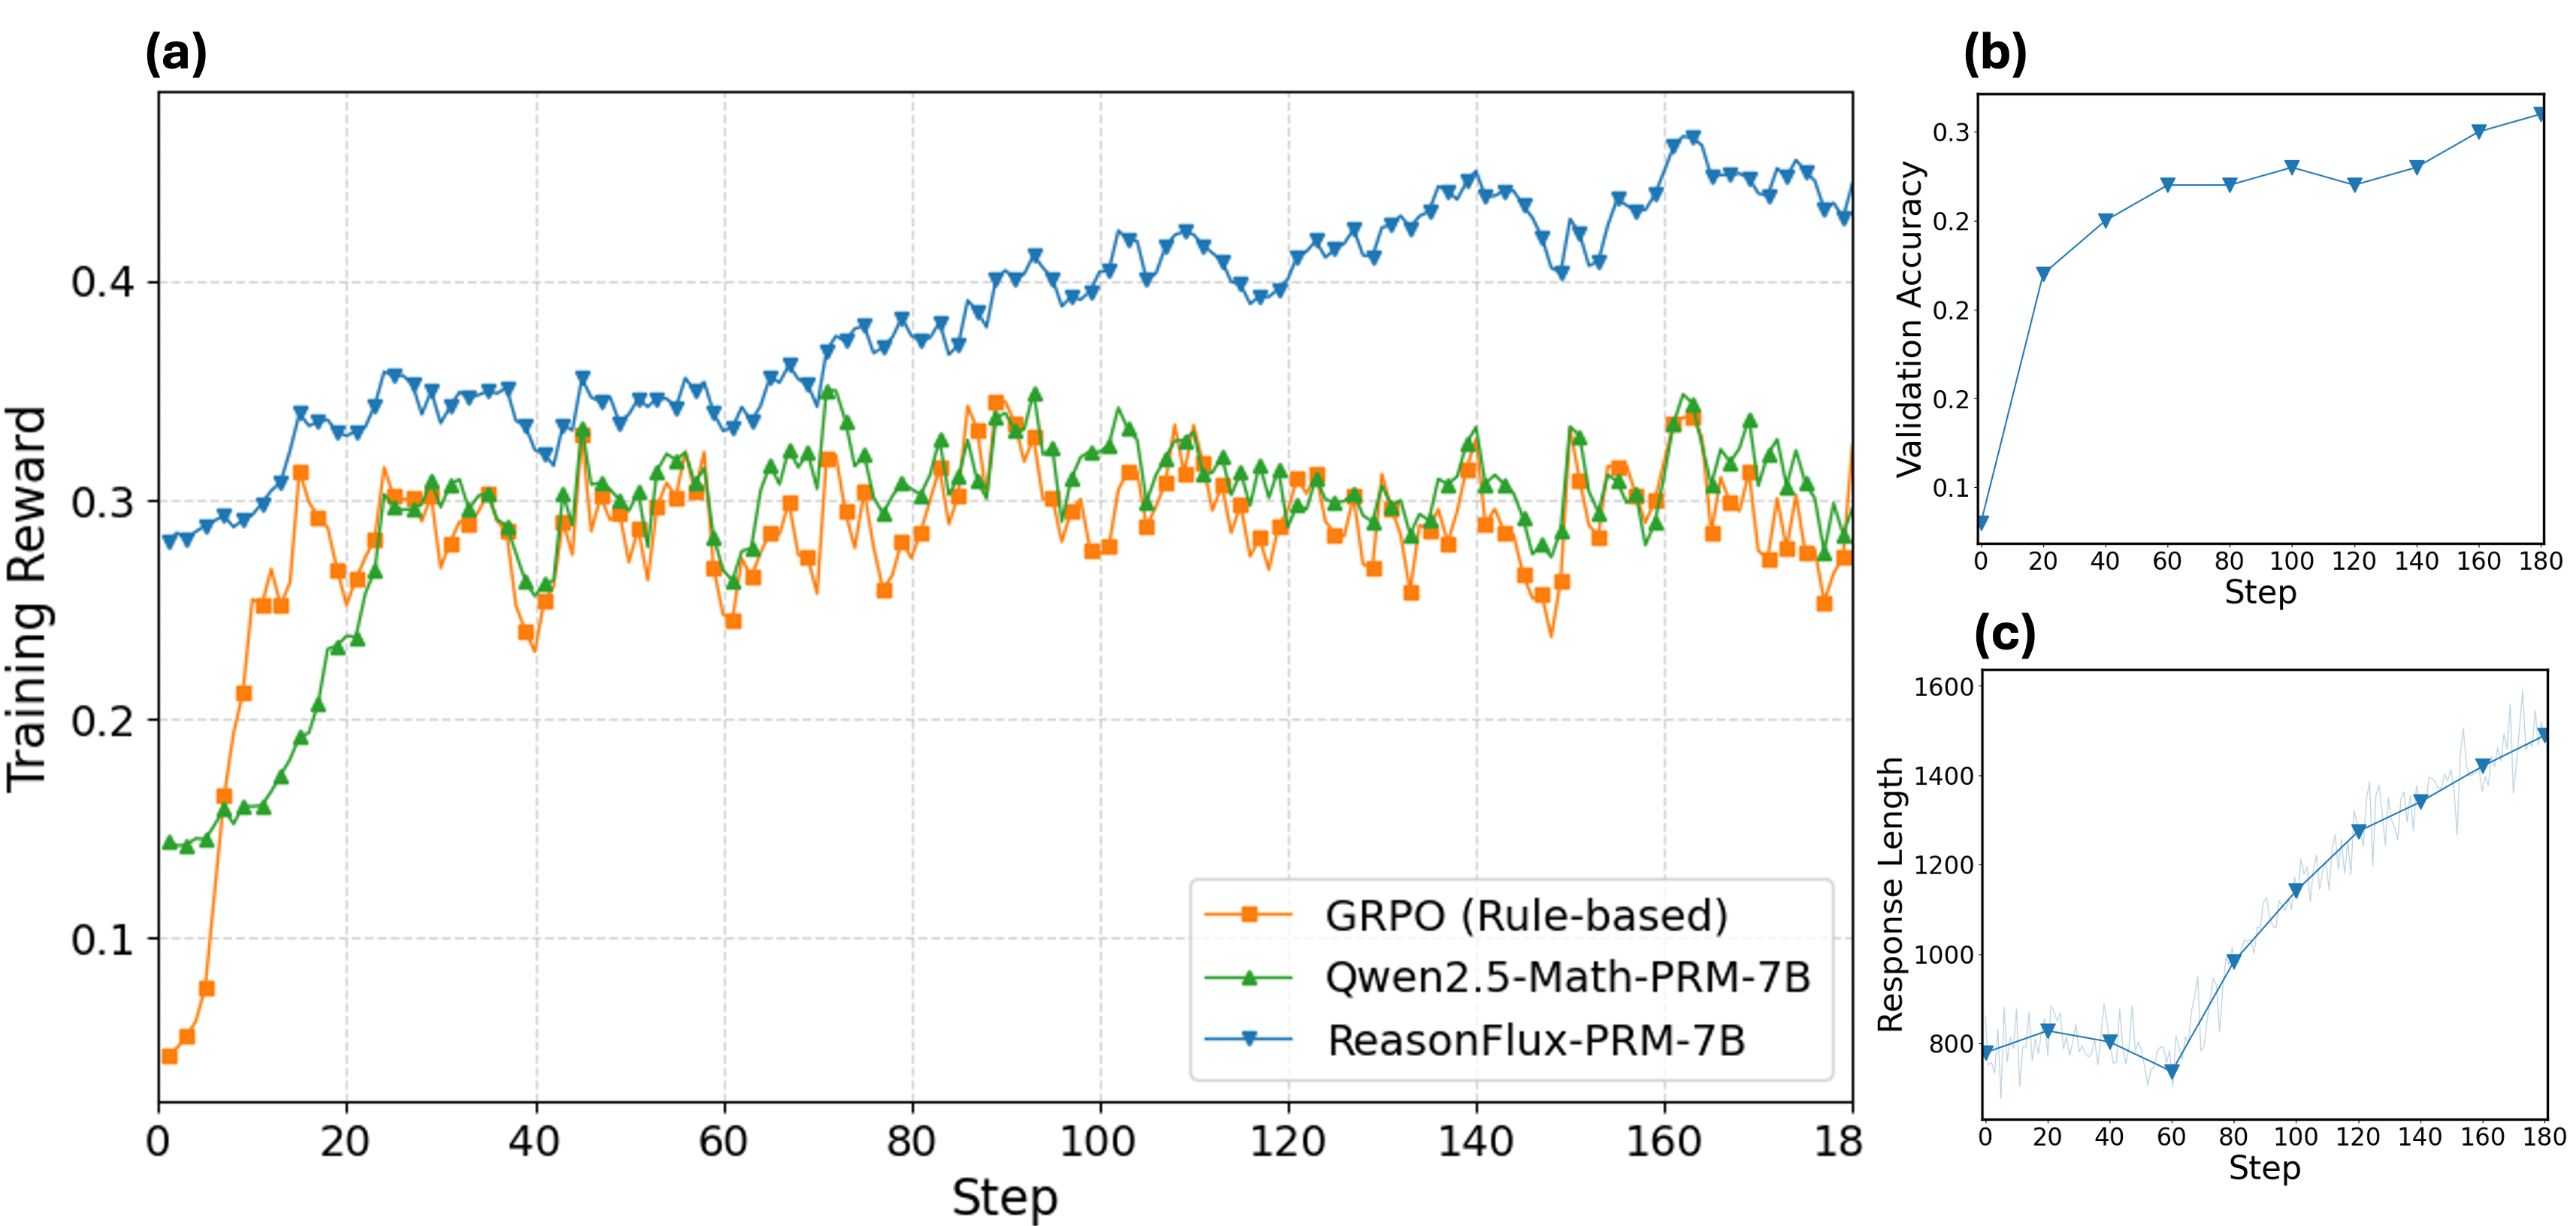
The image contains three line charts (labeled (a), (b), (c)) analyzing training/validation performance and response length for three AI models: **GRPO (Rule-based)**, **Qwen2.5-Math-PRM-7B**, and **ReasonFlux-PRM-7B**.
### Components/Axes
#### Chart (a): Training Reward vs. Step
- **X-axis**: Step (0–180, major ticks: 0, 20, 40, 60, 80, 100, 120, 140, 160, 180).
- **Y-axis**: Training Reward (0–0.4, major ticks: 0, 0.1, 0.2, 0.3, 0.4).
- **Legend**:
- Orange (square markers): GRPO (Rule-based)
- Green (triangle markers): Qwen2.5-Math-PRM-7B
- Blue (diamond markers): ReasonFlux-PRM-7B
#### Chart (b): Validation Accuracy vs. Step
- **X-axis**: Step (0–180, same as (a)).
- **Y-axis**: Validation Accuracy (0–0.3, major ticks: 0, 0.1, 0.2, 0.3).
- **Line**: Blue (diamond markers, consistent with ReasonFlux-PRM-7B in (a)).
#### Chart (c): Response Length vs. Step
- **X-axis**: Step (0–180, same as (a)).
- **Y-axis**: Response Length (800–1600, major ticks: 800, 1000, 1200, 1400, 1600).
- **Line**: Blue (diamond markers, consistent with ReasonFlux-PRM-7B in (a)/(b)), with a light blue shaded region (likely variance/confidence interval).
### Detailed Analysis
#### Chart (a): Training Reward Trends
- **GRPO (Rule-based, orange)**:
- Starts at ~0.05 (step 0), rises sharply to ~0.3 by step 20, then fluctuates between 0.25–0.35 (e.g., dips at steps 40, 60, 100, 140).
- **Qwen2.5-Math-PRM-7B (green)**:
- Starts at ~0.15 (step 0), rises to ~0.25 by step 20, then fluctuates similarly to GRPO (0.25–0.35) but with slightly less volatility.
- **ReasonFlux-PRM-7B (blue)**:
- Starts at ~0.28 (step 0), rises steadily with fluctuations, reaching ~0.45 by step 180. Consistently outperforms GRPO and Qwen2.5 after step 20.
#### Chart (b): Validation Accuracy Trend
- **ReasonFlux-PRM-7B (blue)**:
- Starts at ~0.05 (step 0), rises to ~0.25 by step 20, then plateaus (0.25–0.3) with a slight increase to ~0.3 by step 180.
#### Chart (c): Response Length Trend
- **ReasonFlux-PRM-7B (blue)**:
- Starts at ~800 (step 0), dips to ~750 at step 60, then rises steadily to ~1500 by step 180. The shaded region indicates variance (e.g., ±50–100 in length).
### Key Observations
1. **Training Reward**: ReasonFlux-PRM-7B achieves the highest training reward, outperforming GRPO and Qwen2.5-Math-PRM-7B.
2. **Validation Accuracy**: ReasonFlux-PRM-7B’s validation accuracy improves with steps, reaching ~0.3 (plateauing after step 20).
3. **Response Length**: ReasonFlux-PRM-7B’s response length increases over training (from ~800 to ~1500), with variance (shaded region).
### Interpretation
- **Training Reward**: ReasonFlux’s higher reward suggests it learns more effectively (or is rewarded more) during training, indicating stronger alignment with the reward signal.
- **Validation Accuracy**: The increasing accuracy implies ReasonFlux generalizes well to unseen data, improving with more training steps.
- **Response Length**: Longer responses over time may reflect the model learning to elaborate (e.g., more detailed reasoning) or the reward signal incentivizing longer outputs.
These trends collectively suggest ReasonFlux-PRM-7B outperforms GRPO and Qwen2.5-Math-PRM-7B in training reward, validation accuracy, and response length evolution.