This document contains a technical analysis of two figures comparing a baseline quantization method (GPTQ) against a proposed method ("Ours"). The data focuses on model perplexity (lower is better) in relation to calibration set size and distribution robustness.
---
### **Section 1: Line Chart Analysis**
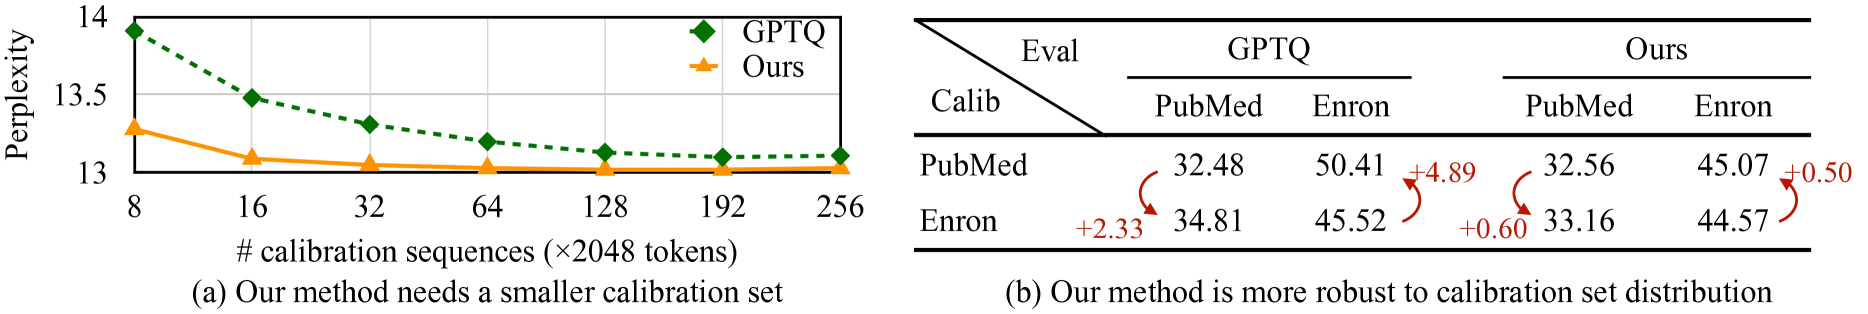
**Caption:** (a) Our method needs a smaller calibration set
#### **1.1 Chart Metadata**
* **Y-Axis Label:** Perplexity
* **Y-Axis Scale:** 13 to 14 (increments of 0.5)
* **X-Axis Label:** # calibration sequences ($\times$2048 tokens)
* **X-Axis Markers:** 8, 16, 32, 64, 128, 192, 256
* **Legend Location:** Top-right [x $\approx$ 0.85, y $\approx$ 0.80]
* **Legend Items:**
* **GPTQ:** Green dashed line with diamond markers ($\blacklozenge$).
* **Ours:** Orange solid line with triangle markers ($\blacktriangle$).
#### **1.2 Trend Verification**
* **GPTQ (Green/Dashed):** Shows a steep downward slope from 8 to 64 sequences, then plateaus/flattens out as it approaches 256 sequences. It consistently maintains a higher perplexity than the proposed method across all points.
* **Ours (Orange/Solid):** Shows a much shallower downward slope. It starts at a significantly lower perplexity than GPTQ and reaches its near-optimal performance much faster (by 32-64 sequences).
#### **1.3 Data Point Extraction (Approximate Values)**
| # Sequences | GPTQ Perplexity (Green) | Ours Perplexity (Orange) |
| :--- | :--- | :--- |
| 8 | ~13.9 | ~13.3 |
| 16 | ~13.5 | ~13.1 |
| 32 | ~13.3 | ~13.05 |
| 64 | ~13.2 | ~13.02 |
| 128 | ~13.15 | ~13.01 |
| 192 | ~13.1 | ~13.01 |
| 256 | ~13.1 | ~13.01 |
---
### **Section 2: Data Table Analysis**
**Caption:** (b) Our method is more robust to calibration set distribution
#### **2.1 Table Structure**
The table is a cross-evaluation matrix comparing the impact of the calibration dataset (Calib) versus the evaluation dataset (Eval) for two different methods.
* **Methods:** GPTQ and Ours.
* **Datasets:** PubMed and Enron.
* **Annotations:** Red curved arrows indicate the "gap" or increase in perplexity when the calibration set does not match the evaluation set.
#### **2.2 Reconstructed Data Table**
| Calib \ Eval | GPTQ: PubMed | GPTQ: Enron | Ours: PubMed | Ours: Enron |
| :--- | :--- | :--- | :--- | :--- |
| **PubMed** | 32.48 | 50.41 | 32.56 | 45.07 |
| **Enron** | 34.81 | 45.52 | 33.16 | 44.57 |
#### **2.3 Robustness Analysis (Red Annotations)**
The red text and arrows highlight the performance degradation when switching calibration sets:
* **GPTQ Method:**
* **PubMed Eval:** Switching calibration from PubMed to Enron increases perplexity by **+2.33** (32.48 $\rightarrow$ 34.81).
* **Enron Eval:** Switching calibration from Enron to PubMed increases perplexity by **+4.89** (45.52 $\rightarrow$ 50.41).
* **Ours Method:**
* **PubMed Eval:** Switching calibration from PubMed to Enron increases perplexity by only **+0.60** (32.56 $\rightarrow$ 33.16).
* **Enron Eval:** Switching calibration from Enron to PubMed increases perplexity by only **+0.50** (44.57 $\rightarrow$ 45.07).
---
### **Summary of Findings**
1. **Efficiency:** The proposed method ("Ours") achieves lower perplexity with only 8 calibration sequences than GPTQ achieves with 256 sequences.
2. **Generalization:** The proposed method is significantly more robust to distribution shifts. While GPTQ's performance degrades by up to 4.89 points when calibrated on a different domain, the proposed method's degradation is limited to $\leq$ 0.60 points.