## Diagram: Directed Acyclic Graphs
### Overview
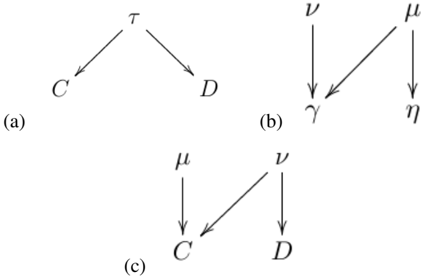
The image presents three directed acyclic graphs, labeled (a), (b), and (c). Each graph consists of nodes represented by Greek or Latin letters and directed edges (arrows) indicating relationships or dependencies between the nodes.
### Components/Axes
* **Nodes:** Represented by the following symbols: τ, C, D, ν, μ, γ, η.
* **Edges:** Represented by arrows, indicating the direction of the relationship.
* **Labels:** (a), (b), and (c) identify each graph.
### Detailed Analysis
**Graph (a):**
* Node τ (tau) has two outgoing edges.
* One edge points from τ to node C.
* The other edge points from τ to node D.
**Graph (b):**
* Node ν (nu) has one outgoing edge pointing to node γ (gamma).
* Node μ (mu) has two outgoing edges.
* One edge points from μ to node γ (gamma).
* The other edge points from μ to node η (eta).
**Graph (c):**
* Node μ (mu) has one outgoing edge pointing to node C.
* Node ν (nu) has one outgoing edge pointing to node D.
### Key Observations
* Each graph represents a different set of relationships between the nodes.
* The arrows indicate the direction of influence or dependency.
* No cycles are present in any of the graphs, confirming they are acyclic.
### Interpretation
The diagrams illustrate different causal or relational structures. Each graph shows how one variable or entity (represented by a node) influences or is related to other variables or entities. The direction of the arrows indicates the direction of influence. These types of diagrams are commonly used in various fields, including Bayesian networks, causal inference, and systems modeling, to represent dependencies and relationships between variables.