\n
## Directed Acyclic Graph (DAG) Diagrams: Causal or Dependency Structures
### Overview
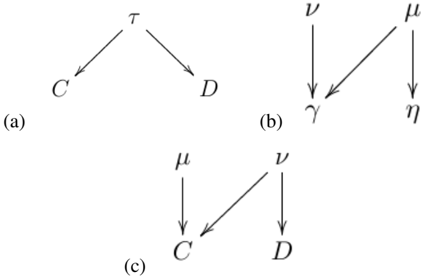
The image displays three separate directed acyclic graphs (DAGs), labeled (a), (b), and (c). Each diagram consists of nodes represented by Greek letters and the Latin letters "C" and "D", connected by directed arrows indicating a one-way relationship or influence. The diagrams are arranged with (a) in the top-left, (b) in the top-right, and (c) centered at the bottom.
### Components/Nodes
The diagrams contain the following nodes:
* **Latin Letters:** `C`, `D`
* **Greek Letters:** `τ` (tau), `ν` (nu), `μ` (mu), `γ` (gamma), `η` (eta)
### Detailed Analysis
**Diagram (a) - Top Left:**
* **Structure:** A single root node `τ` points to two child nodes, `C` and `D`.
* **Flow:** `τ` → `C` and `τ` → `D`. This suggests `τ` is a common cause or parent variable influencing both `C` and `D`.
**Diagram (b) - Top Right:**
* **Structure:** Two root nodes, `ν` and `μ`, both point to a common node `γ`. Additionally, `μ` points to a separate node `η`.
* **Flow:** `ν` → `γ`, `μ` → `γ`, and `μ` → `η`. This indicates `γ` is a collider or common effect of `ν` and `μ`. `η` is an additional effect solely of `μ`.
**Diagram (c) - Bottom Center:**
* **Structure:** Two root nodes, `μ` and `ν`. `μ` points to `C`. `ν` points to both `C` and `D`.
* **Flow:** `μ` → `C`, `ν` → `C`, and `ν` → `D`. Here, `C` is a collider of `μ` and `ν`, while `D` is an effect solely of `ν`.
### Key Observations
1. **Variable Reuse:** The variables `C` and `D` appear in diagrams (a) and (c), but their causal parents differ. In (a), they share a common parent `τ`. In (c), `C` has parents `μ` and `ν`, while `D` has only `ν`.
2. **Structural Contrast:** Diagram (a) shows a "common cause" structure. Diagram (b) shows a "common effect" (collider) structure for `γ` and an additional direct path. Diagram (c) shows a mixed structure where `C` is a collider and `D` is a direct effect.
3. **Node Isolation:** In diagram (b), node `η` is only connected to `μ`, making it a terminal node not involved in the `ν-μ-γ` relationship.
### Interpretation
These diagrams are typical representations used in causal inference, statistics, or probabilistic graphical models to encode assumptions about the relationships between variables.
* **Diagram (a)** implies that `C` and `D` are correlated because they share a common cause `τ`, but there is no direct causal link between `C` and `D`.
* **Diagram (b)** illustrates a collider (`γ`). Conditioning on `γ` (e.g., by selecting cases where `γ` has a specific value) would induce a spurious correlation between its causes `ν` and `μ`. `η` is an independent outcome of `μ`.
* **Diagram (c)** presents a more complex scenario. `C` is influenced by both `μ` and `ν`. `D` is influenced only by `ν`. This structure suggests that `ν` is a confounder for the relationship between `μ` and `D` if one were to consider it, but more directly, it shows `ν` affecting both an intermediate variable `C` and a final outcome `D`.
The progression from (a) to (c) may illustrate different modeling choices for a set of variables, highlighting how assumed causal structures change the interpretation of dependencies. The absence of numerical data means this is purely a structural or conceptual representation.