# Technical Document Extraction: Bar Chart Analysis
## 1. Chart Title and Labels
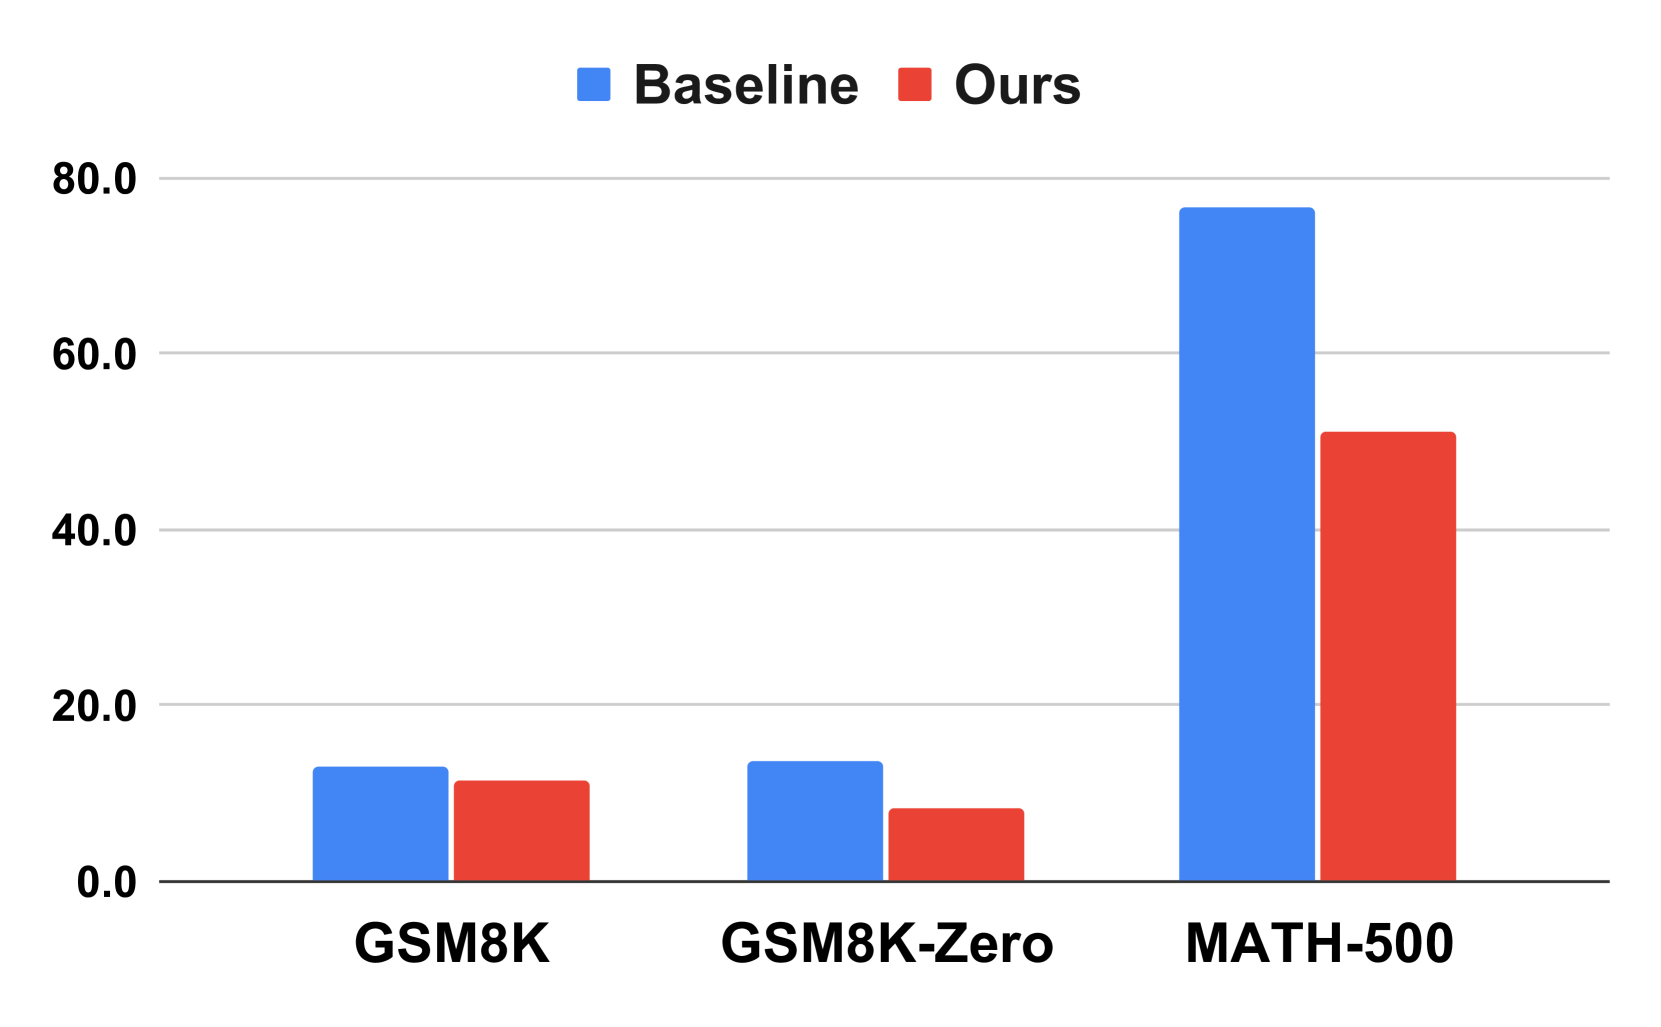
- **Title**: "Baseline vs Ours Performance on Different Datasets"
- **X-Axis Labels**:
- GSM8K
- GSM8K-Zero
- MATH-500
- **Y-Axis Label**: Numerical scale (0.0 to 80.0, increments of 20.0)
- **Legend**:
- **Blue**: Baseline
- **Red**: Ours
## 2. Data Points and Trends
### Spatial Grounding of Data Series
- **Legend Position**: Top-center (x: [0.4, 0.6], y: [0.95, 1.0])
- **Color Consistency Check**:
- Blue bars correspond to "Baseline"
- Red bars correspond to "Ours"
### Component Isolation
#### Main Chart Region
| Dataset | Baseline (Blue) | Ours (Red) | Visual Trend Description |
|---------------|-----------------|------------|--------------------------|
| **GSM8K** | ~12.0 | ~10.0 | Baseline > Ours |
| **GSM8K-Zero**| ~13.0 | ~7.0 | Baseline > Ours |
| **MATH-500** | ~78.0 | ~50.0 | Baseline > Ours |
### Trend Verification
- **Baseline Series**:
- Slopes upward across datasets (12.0 → 13.0 → 78.0)
- Sharp increase observed between GSM8K-Zero and MATH-500
- **Ours Series**:
- Peaks at MATH-500 (50.0)
- Declines from GSM8K-Zero to MATH-500 (7.0 → 50.0)
## 3. Axis Markers
- **Y-Axis Ticks**: 0.0, 20.0, 40.0, 60.0, 80.0
- **X-Axis Ticks**: Centered under each dataset label
## 4. Structural Analysis
- **Header**: Legend (blue/red labels)
- **Main Chart**: Three grouped bars per dataset
- **Footer**: No additional text or components
## 5. Critical Observations
1. **Performance Gap**:
- Ours underperforms Baseline in GSM8K and GSM8K-Zero
- Ours achieves 50.0 on MATH-500 vs Baseline's 78.0
2. **Scale Utilization**:
- Y-axis max (80.0) only reached by Baseline on MATH-500
- Ours never exceeds 50.0 across all datasets
## 6. Missing Elements
- No gridlines or error bars present
- No textual annotations on bars or axes
## 7. Language Declaration
- All text in English. No non-English content detected.