## Line Graph: Accuracy vs Compute (exaFLOP)
### Overview
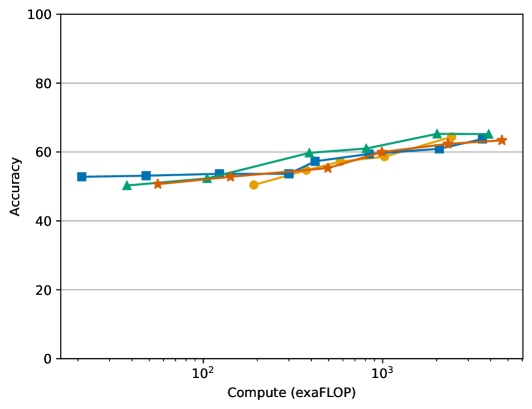
The graph illustrates the relationship between computational power (measured in exaFLOP) and accuracy across four models. Accuracy is plotted on the y-axis (0–100%), while compute is on the x-axis (logarithmic scale: 10² to 10³ exaFLOP). Four data series are represented by distinct markers and colors, with a legend on the right.
### Components/Axes
- **X-axis**: "Compute (exaFLOP)" with logarithmic scaling (10² to 10³).
- **Y-axis**: "Accuracy" (0–100%).
- **Legend**:
- Blue squares: Model A
- Green triangles: Model B
- Orange circles: Model C
- Red stars: Model D
- **Title**: "Accuracy vs Compute (exaFLOP)" (top-center).
### Detailed Analysis
1. **Model A (Blue Squares)**:
- Starts at ~50% accuracy at 10² exaFLOP.
- Gradually increases to ~60% at 10³ exaFLOP.
- Slope: Moderate upward trend.
2. **Model B (Green Triangles)**:
- Begins at ~45% accuracy at 10² exaFLOP.
- Sharp rise to ~65% at 10³ exaFLOP.
- Slope: Steepest upward trajectory.
3. **Model C (Orange Circles)**:
- Starts at ~50% accuracy at 10² exaFLOP.
- Dips to ~45% at ~10².⁵ exaFLOP (midpoint).
- Recovers to ~60% at 10³ exaFLOP.
- Slope: Initial decline, then steady increase.
4. **Model D (Red Stars)**:
- Begins at ~50% accuracy at 10² exaFLOP.
- Consistent rise to ~62% at 10³ exaFLOP.
- Slope: Steady upward trend.
### Key Observations
- All models show improved accuracy with increased compute.
- **Model B** achieves the highest accuracy (~65%) at 10³ exaFLOP.
- **Model C** exhibits a temporary dip at ~10².⁵ exaFLOP but recovers.
- **Model D** demonstrates the most consistent scaling.
- Accuracy plateaus near 60–65% for all models at 10³ exaFLOP.
### Interpretation
The data suggests a positive correlation between computational power and accuracy, with diminishing returns as compute approaches 10³ exaFLOP. **Model B** is the most efficient, achieving the highest accuracy with the steepest improvement. **Model C**'s dip may indicate a temporary inefficiency or optimization challenge at intermediate compute levels. The convergence of accuracy near 60–65% at 10³ exaFLOP implies a potential ceiling for these models, highlighting the need for architectural or algorithmic innovations beyond this compute threshold.