# Technical Document Extraction: Workflow Optimization Stages
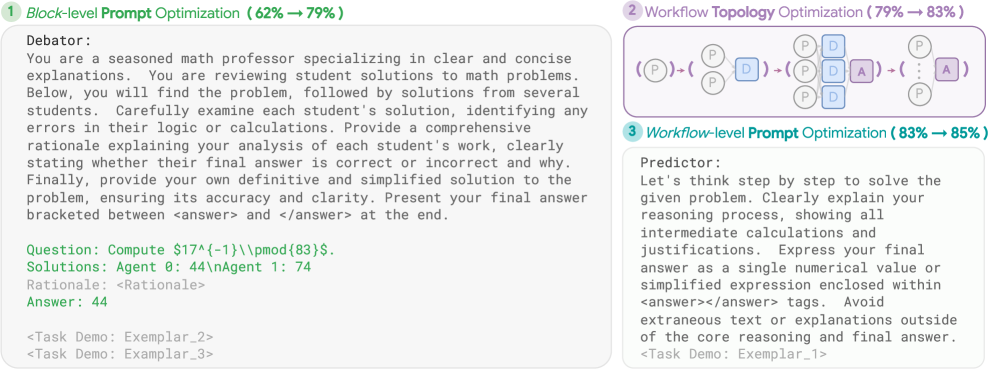
This image illustrates a three-stage optimization process for a Large Language Model (LLM) workflow, showing the progression of performance metrics (percentage increases) alongside the specific prompt and structural changes made at each stage.
---
## 1. Block-level Prompt Optimization (62% → 79%)
**Location:** Left side of the image.
**Description:** This stage focuses on refining the system prompt for a specific role ("Debator") to improve accuracy from 62% to 79%.
### Transcribed Content:
**Role:** `Debator:`
**System Prompt Text:**
> "You are a seasoned math professor specializing in clear and concise explanations. You are reviewing student solutions to math problems. Below, you will find the problem, followed by solutions from several students. Carefully examine each student's solution, identifying any errors in their logic or calculations. Provide a comprehensive rationale explaining your analysis of each student's work, clearly stating whether their final answer is correct or incorrect and why. Finally, provide your own definitive and simplified solution to the problem, ensuring its accuracy and clarity. Present your final answer bracketed between \<answer\> and \</answer\> at the end."
**Input/Output Structure:**
* **Question (Green):** `Compute $17^{-1} \pmod{83}$.`
* **Solutions (Green):** `Agent 0: 44\nAgent 1: 74`
* **Rationale (Grey):** `<Rationale>`
* **Answer (Green):** `44`
* **Metadata (Grey):**
* `<Task Demo: Exemplar_2>`
* `<Task Demo: Exemplar_3>`
---
## 2. Workflow Topology Optimization (79% → 83%)
**Location:** Top right of the image.
**Description:** This stage illustrates a structural change in the workflow's graph topology, moving from a simple sequence to a more complex parallel and iterative structure.
### Diagram Components and Flow:
The diagram uses a node-link representation to show the evolution of the process:
1. **Initial State:** A single node labeled **(P)** (Predictor).
2. **Second State:** Two **P** nodes in parallel feeding into a blue node labeled **D** (Debator).
3. **Third State:** Three **P** nodes in parallel feeding into two blue **D** nodes, which then feed into a purple node labeled **A** (Aggregator/Final Answer).
4. **Final State:** A vertical ellipsis indicating multiple **P** nodes feeding into a final purple **A** node.
**Trend:** The complexity of the "topology" (the arrangement of nodes) increases, leading to a 4% gain in performance.
---
## 3. Workflow-level Prompt Optimization (83% → 85%)
**Location:** Bottom right of the image.
**Description:** This final stage involves optimizing the prompt for the "Predictor" role within the newly established topology, resulting in a final performance of 85%.
### Transcribed Content:
**Role:** `Predictor:`
**System Prompt Text:**
> "Let's think step by step to solve the given problem. Clearly explain your reasoning process, showing all intermediate calculations and justifications. Express your final answer as a single numerical value or simplified expression enclosed within \<answer\>\</answer\> tags. Avoid extraneous text or explanations outside of the core reasoning and final answer."
**Metadata (Grey):**
* `<Task Demo: Exemplar_1>`
---
## Summary of Performance Gains
| Optimization Stage | Performance Metric | Net Gain |
| :--- | :--- | :--- |
| 1. Block-level Prompt Optimization | 62% → 79% | +17% |
| 2. Workflow Topology Optimization | 79% → 83% | +4% |
| 3. Workflow-level Prompt Optimization | 83% → 85% | +2% |
| **Total Improvement** | **62% → 85%** | **+23%** |