## Heatmap: Transition Probabilities Heatmap
### Overview
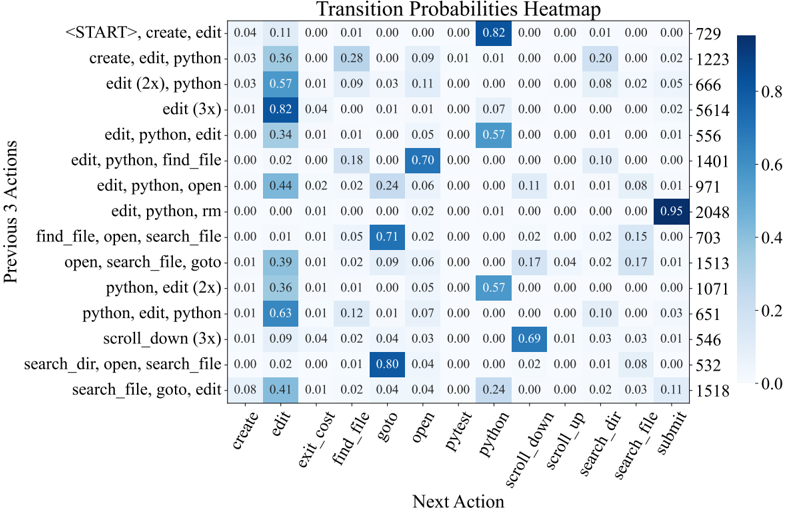
The image is a heatmap visualizing transition probabilities between sequences of actions. It shows the likelihood of transitioning from a "Previous 3 Actions" sequence to a "Next Action" category, with probabilities ranging from 0.0 to 0.95. Darker blue cells indicate higher probabilities, while lighter blue or white cells represent lower or zero probabilities.
---
### Components/Axes
- **Y-Axis (Previous 3 Actions)**:
Labels represent sequences of three actions, e.g., `<START>, create, edit`, `create, edit, python`, `edit (2x), python`, etc. There are 15 rows in total.
- **X-Axis (Next Action)**:
Categories include `create`, `edit`, `exit_cost`, `find_file`, `goto`, `open`, `pytest`, `python`, `scroll_down`, `scroll_up`, `search_dir`, `search_file`, and `submit`. There are 15 columns.
- **Legend**:
A color scale from light blue (0.0) to dark blue (0.8+), with numerical thresholds: 0.0, 0.2, 0.4, 0.6, 0.8.
- **Right-Side Counts**:
Numerical values (e.g., 729, 1223, 666) likely represent the frequency of transitions for each cell.
---
### Detailed Analysis
- **High-Probability Transitions**:
- The first row (`<START>, create, edit`) has a 0.82 probability of transitioning to `edit`.
- The last row (`search_file, goto, edit`) has a 0.95 probability of transitioning to `submit`.
- The row `edit, python, rm` has a 0.71 probability of transitioning to `find_file`.
- **Low-Probability Transitions**:
- Many cells contain 0.00, indicating no observed transitions (e.g., `edit, python, open` → `python`).
- The row `search_dir, open, search_file` has a 0.80 probability of transitioning to `goto`.
- **Notable Counts**:
- The highest count (2048) corresponds to the 0.95 probability in the last row.
- The lowest count (532) corresponds to a 0.08 probability in the row `search_file, goto, edit`.
---
### Key Observations
1. **Dominant Transitions**:
- The `submit` action is almost certain (0.95) after the sequence `search_file, goto, edit`.
- The `edit` action is a common next step in early sequences (e.g., 0.82, 0.57, 0.63).
2. **Sparse Transitions**:
- Many actions (e.g., `pytest`, `scroll_up`) have near-zero probabilities in most contexts.
3. **Sequence Dependency**:
- Later actions in sequences (e.g., `python` in `edit, python, rm`) influence subsequent steps.
---
### Interpretation
The heatmap reveals patterns in action sequences, likely from a user interface or code editor workflow. Key insights:
- **Predictability**: The `submit` action is highly predictable after specific sequences, suggesting a structured workflow.
- **Repetition**: The `edit` action frequently follows initial sequences, indicating iterative workflows.
- **Sparsity**: Many transitions (e.g., `open` → `python`) are rare, highlighting less common user behaviors.
- **Count Correlation**: Higher counts align with higher probabilities, suggesting the data reflects observed frequencies.
This analysis could inform UI design, user behavior modeling, or workflow optimization by identifying common and rare action patterns.