## Diagram: Language Model Processing of Factual Queries
### Overview
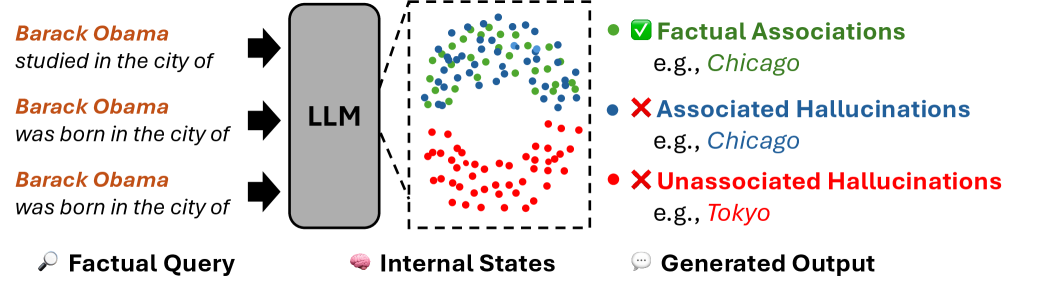
This diagram illustrates the process of a Large Language Model (LLM) handling factual queries about Barack Obama's birthplace, showing how internal states map to generated outputs with varying degrees of factual accuracy. The visualization uses color-coded dots to represent different types of associations within the model's internal states.
### Components/Axes
- **Left Panel**: Textual factual queries about Barack Obama (three identical queries about his birthplace).
- **Central Block**: Labeled "LLM" (Large Language Model), acting as the processing unit.
- **Internal States Box**: Contains colored dots representing different association types:
- Green dots: Factual Associations (e.g., "Chicago")
- Blue dots: Associated Hallucinations (e.g., "Chicago")
- Red dots: Unassociated Hallucinations (e.g., "Tokyo")
- **Right Panel**: Generated Output section with color-coded labels matching the internal states.
- **Legend**: Located in the top-right corner, mapping colors to association types.
### Detailed Analysis
1. **Factual Queries**:
- Three identical queries: "Barack Obama studied in the city of" and "Barack Obama was born in the city of" (repeated three times).
- Positioned on the far left, connected via arrows to the LLM block.
2. **Internal States**:
- A box containing clustered dots in three colors:
- **Green (Factual)**: Clustered in the upper-left quadrant, representing correct associations (e.g., "Chicago").
- **Blue (Associated Hallucinations)**: Mixed with green dots but slightly offset, indicating partial correctness (e.g., "Chicago" but in wrong context).
- **Red (Unassociated Hallucinations)**: Clustered in the lower-right quadrant, representing entirely incorrect associations (e.g., "Tokyo").
3. **Generated Output**:
- Three labeled examples on the far right:
- Green checkmark: "Factual Associations" (e.g., "Chicago").
- Blue X: "Associated Hallucinations" (e.g., "Chicago").
- Red X: "Unassociated Hallucinations" (e.g., "Tokyo").
### Key Observations
- **Color Distribution**:
- Green dots dominate the upper-left, suggesting strong factual grounding for correct answers.
- Blue dots are interspersed with green, indicating the model sometimes associates correct entities but with contextual errors.
- Red dots are isolated in the lower-right, showing clear separation from factual associations.
- **Spatial Grounding**:
- The legend is positioned in the top-right, ensuring easy reference for all viewers.
- Arrows flow left-to-right, emphasizing the sequential processing from query → LLM → internal states → output.
### Interpretation
This diagram demonstrates how an LLM processes factual queries through internal states that encode both correct and incorrect associations. The color-coded dots reveal:
1. **Factual Accuracy**: Green dots represent reliable knowledge (e.g., Obama's birthplace as Chicago).
2. **Hallucination Patterns**:
- **Associated Hallucinations** (blue): The model retains partial correctness (e.g., mentioning Chicago but in an incorrect context).
- **Unassociated Hallucinations** (red): Complete fabrication (e.g., Tokyo), showing the model's vulnerability to generating entirely false information.
The spatial separation of red dots suggests the model has mechanisms to suppress entirely incorrect associations, but the presence of blue dots highlights challenges in maintaining contextual accuracy. This visualization underscores the tension between factual retrieval and creative generation in LLMs, with implications for improving model reliability in knowledge-intensive tasks.