# Technical Document Extraction: LLM Internal States and Hallucination Analysis
## 1. Overview
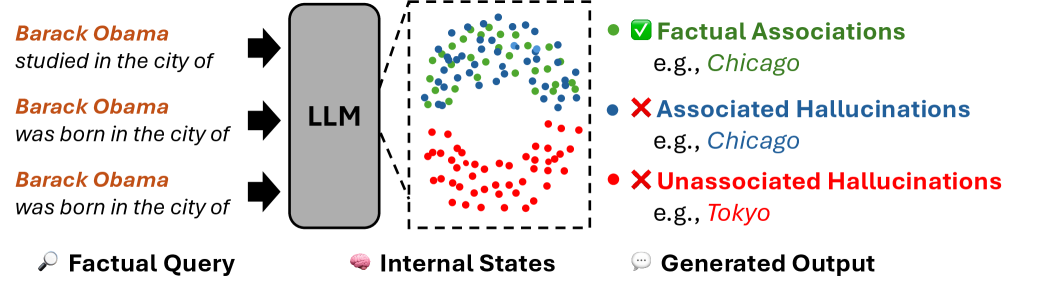
This image is a conceptual technical diagram illustrating how a Large Language Model (LLM) processes factual queries and the relationship between its internal latent states and the resulting generated output. It specifically categorizes outputs into factual associations, associated hallucinations, and unassociated hallucinations based on their proximity within the model's internal representation space.
---
## 2. Component Segmentation
### Region A: Factual Query (Input)
Located on the far left, this section represents the prompts fed into the model.
* **Icon:** 🔍 (Magnifying glass)
* **Label:** Factual Query
* **Transcribed Text (Input Prompts):**
1. *Barack Obama studied in the city of*
2. *Barack Obama was born in the city of*
3. *Barack Obama was born in the city of*
* **Visual Flow:** Three black arrows point from these text prompts toward the central LLM block.
### Region B: Internal States (Processing)
Located in the center, this section visualizes the model's latent space.
* **Icon:** 🧠 (Brain)
* **Label:** Internal States
* **Components:**
* **LLM Block:** A grey vertical rounded rectangle labeled "**LLM**".
* **Latent Space Projection:** A dashed-line square box connected to the LLM by diverging dashed lines, indicating a "zoom-in" on internal activations.
* **Data Distribution:** Inside the box is a scatter plot of colored dots arranged in a roughly circular/annular distribution.
* **Top Half:** Contains a mix of **Green** and **Blue** dots.
* **Bottom Half:** Contains primarily **Red** dots.
* **Center:** A void or empty space in the middle of the distribution.
### Region C: Generated Output (Legend and Results)
Located on the right, this section defines the categories of the model's response.
* **Icon:** 💬 (Speech bubble)
* **Label:** Generated Output
* **Legend and Classification:**
1. **Green Dot + ✅ Factual Associations**
* *Example:* e.g., *Chicago*
* *Spatial Grounding:* Corresponds to the green dots in the top half of the internal state plot.
2. **Blue Dot + ❌ Associated Hallucinations**
* *Example:* e.g., *Chicago*
* *Spatial Grounding:* Corresponds to the blue dots intermingled with green dots in the top half of the internal state plot.
3. **Red Dot + ❌ Unassociated Hallucinations**
* *Example:* e.g., *Tokyo*
* *Spatial Grounding:* Corresponds to the cluster of red dots in the bottom half of the internal state plot.
---
## 3. Logic and Trend Analysis
### Data Relationship Logic
The diagram establishes a spatial correlation between the "correctness" of an answer and its position in the LLM's internal state:
* **Clustering of Truth and Related Errors:** The **Green** (Factual) and **Blue** (Associated Hallucination) dots are spatially clustered together. This suggests that when the model hallucinates a "related" but incorrect fact (e.g., saying Obama was born in Chicago because he is strongly associated with that city), the internal state is nearly identical to the state for a factual truth.
* **Isolation of Unrelated Errors:** The **Red** dots (Unassociated Hallucinations, like "Tokyo") are clustered in a completely different region of the latent space. This indicates that "random" or unassociated hallucinations represent a distinct internal state compared to factual or contextually relevant information.
### Summary of Mappings
| Category | Internal State Region | Example Output | Status |
| :--- | :--- | :--- | :--- |
| **Factual Association** | Top Cluster (Mixed) | Chicago (as study location) | Correct |
| **Associated Hallucination** | Top Cluster (Mixed) | Chicago (as birth location) | Incorrect (but related) |
| **Unassociated Hallucination** | Bottom Cluster | Tokyo (as birth location) | Incorrect (unrelated) |
---
## 4. Language Declaration
* **Primary Language:** English (100%).
* **Note:** No other languages are present in the document. All text is transcribed directly as seen.