## Line Chart: Performance Comparison of ActPRM Selection vs. Random Selection
### Overview
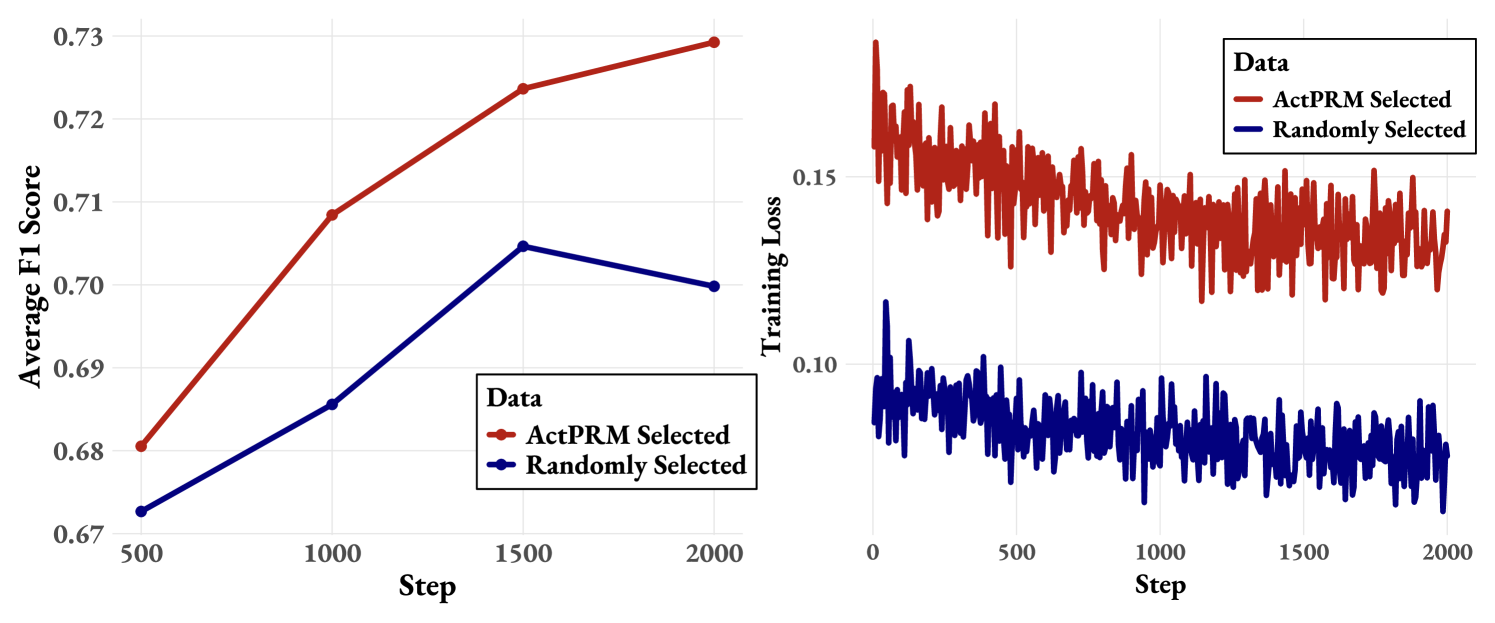
The image presents two line charts side-by-side, comparing the performance of "ActPRM Selected" and "Randomly Selected" methods across 2000 steps. The left chart displays the Average F1 Score, while the right chart shows the Training Loss. Both charts share a common x-axis representing "Step".
### Components/Axes
* **Left Chart:**
* X-axis: "Step" (Scale: 500 to 2000, increments of 250)
* Y-axis: "Average F1 Score" (Scale: 0.67 to 0.73, increments of 0.01)
* Legend (bottom-left): "Data"
* "ActPRM Selected" (Red line with circular markers)
* "Randomly Selected" (Blue line with circular markers)
* **Right Chart:**
* X-axis: "Step" (Scale: 0 to 2000, increments of 250)
* Y-axis: "Training Loss" (Scale: 0.08 to 0.16, increments of 0.01)
* Legend (top-right): "Data"
* "ActPRM Selected" (Red line)
* "Randomly Selected" (Blue line)
### Detailed Analysis or Content Details
* **Left Chart (Average F1 Score):**
* **ActPRM Selected (Red):** The line slopes upward, indicating increasing F1 score with increasing steps.
* Step 500: Approximately 0.675
* Step 750: Approximately 0.685
* Step 1000: Approximately 0.698
* Step 1250: Approximately 0.715
* Step 1500: Approximately 0.722
* Step 1750: Approximately 0.728
* Step 2000: Approximately 0.73
* **Randomly Selected (Blue):** The line initially increases, then plateaus and slightly decreases.
* Step 500: Approximately 0.682
* Step 750: Approximately 0.692
* Step 1000: Approximately 0.705
* Step 1250: Approximately 0.708
* Step 1500: Approximately 0.704
* Step 1750: Approximately 0.702
* Step 2000: Approximately 0.701
* **Right Chart (Training Loss):**
* **ActPRM Selected (Red):** The line fluctuates significantly, generally decreasing over time but with substantial variance.
* Step 0: Approximately 0.155
* Step 500: Approximately 0.145
* Step 1000: Approximately 0.135
* Step 1500: Approximately 0.14
* Step 2000: Approximately 0.13
* **Randomly Selected (Blue):** The line also fluctuates, but remains consistently lower than the "ActPRM Selected" line.
* Step 0: Approximately 0.11
* Step 500: Approximately 0.095
* Step 1000: Approximately 0.10
* Step 1500: Approximately 0.11
* Step 2000: Approximately 0.105
### Key Observations
* The "ActPRM Selected" method consistently achieves a higher Average F1 Score than the "Randomly Selected" method.
* The "ActPRM Selected" method exhibits higher Training Loss compared to the "Randomly Selected" method.
* Both methods show decreasing Training Loss over time, but with considerable fluctuations.
* The F1 score for "Randomly Selected" plateaus after step 1000, while "ActPRM Selected" continues to improve.
### Interpretation
The data suggests that while the "ActPRM Selected" method results in a higher F1 score, indicating better predictive performance, it also leads to a higher Training Loss. This could indicate a more complex model that is potentially overfitting to the training data. The "Randomly Selected" method, while achieving a lower F1 score, maintains a lower Training Loss, suggesting a simpler model that generalizes better but may not capture the nuances of the data as effectively. The continued improvement in F1 score for "ActPRM Selected" even after the "Randomly Selected" method plateaus suggests that the former method benefits from continued training, despite the higher loss. The fluctuations in Training Loss for both methods suggest that the training process is not entirely stable and may benefit from techniques like regularization or learning rate scheduling. The difference in loss could also be due to the complexity of the model, or the amount of data used.