## Line Graphs: Average F1 Score and Training Loss Comparison
### Overview
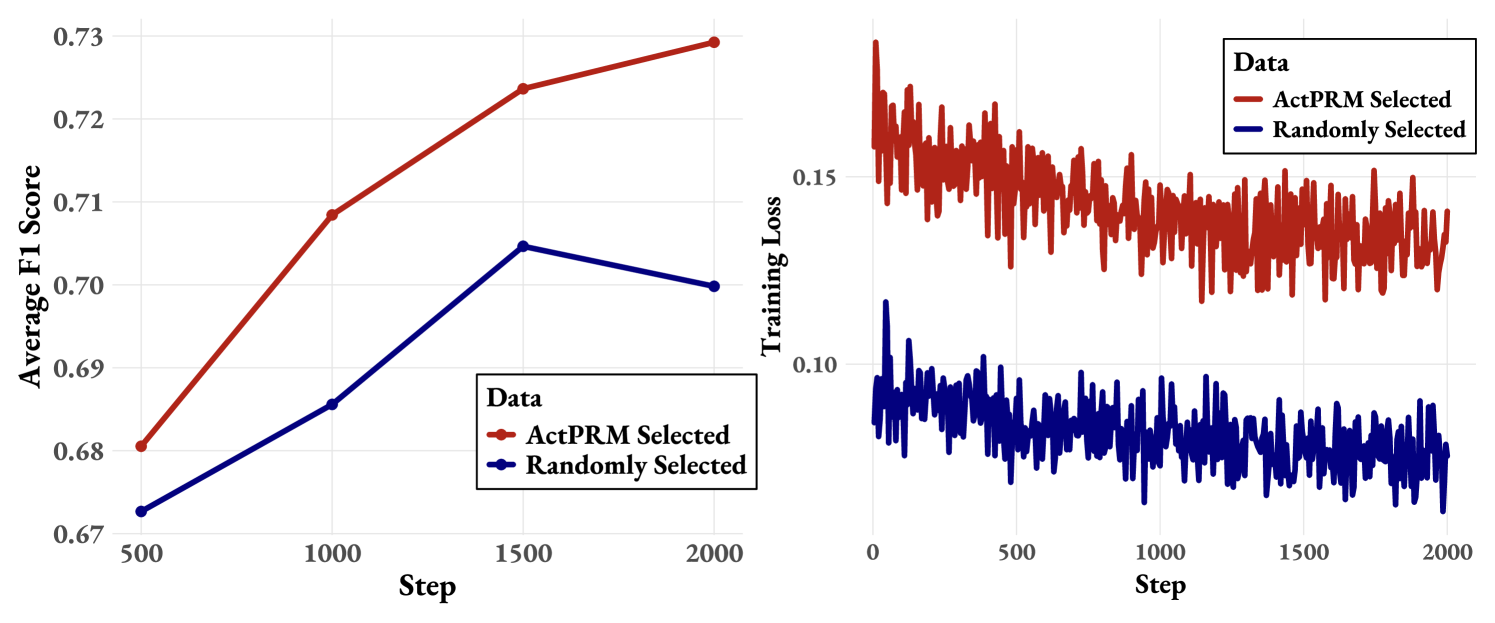
The image contains two line graphs comparing performance metrics for two data selection methods: "ActPRM Selected" (red) and "Randomly Selected" (blue). The left graph tracks **Average F1 Score** over training steps, while the right graph tracks **Training Loss** over the same steps.
---
### Components/Axes
#### Left Graph (Average F1 Score)
- **X-axis**: "Step" (discrete markers at 500, 1000, 1500, 2000)
- **Y-axis**: "Average F1 Score" (range: 0.67–0.73)
- **Legend**: Located in the bottom-right corner, with red = "ActPRM Selected" and blue = "Randomly Selected"
#### Right Graph (Training Loss)
- **X-axis**: "Step" (continuous from 0 to 2000)
- **Y-axis**: "Training Loss" (range: 0.09–0.15)
- **Legend**: Located in the top-right corner, matching colors to labels
---
### Detailed Analysis
#### Left Graph (Average F1 Score)
- **ActPRM Selected (Red Line)**:
- Starts at **0.68** at step 500.
- Increases steadily to **0.73** at step 2000.
- Slope: Approximately +0.005 per 500 steps.
- **Randomly Selected (Blue Line)**:
- Starts at **0.67** at step 500.
- Rises to **0.70** at step 1500, then plateaus at **0.70** at step 2000.
- Slope: +0.003 per 500 steps initially, then flat.
#### Right Graph (Training Loss)
- **ActPRM Selected (Red Line)**:
- Starts at **0.15** at step 0.
- Decreases steadily to **0.10** by step 2000.
- Slope: Approximately -0.00025 per step.
- **Randomly Selected (Blue Line)**:
- Starts at **0.10** at step 0.
- Fluctuates between **0.09–0.10** throughout, with no clear trend.
- Higher volatility compared to ActPRM.
---
### Key Observations
1. **ActPRM Selected** consistently outperforms "Randomly Selected" in both metrics:
- Higher F1 Score (0.73 vs. 0.70).
- Lower Training Loss (0.10 vs. 0.09–0.10).
2. **Training Loss** for ActPRM shows a smooth decline, while Randomly Selected exhibits erratic fluctuations.
3. **F1 Score** for ActPRM improves linearly, whereas Randomly Selected plateaus after step 1500.
---
### Interpretation
The data suggests that the **ActPRM Selected** method is significantly more effective than random selection for the task analyzed. The ActPRM method demonstrates:
- **Improved generalization**: Higher F1 Score indicates better balance between precision and recall.
- **Stable training**: Lower and more consistent Training Loss suggests better optimization of model parameters.
- **Scalability**: The linear improvement in F1 Score and steady reduction in loss imply that ActPRM benefits from increased training steps.
The Randomly Selected method, while initially competitive, fails to maintain performance gains and exhibits higher training instability. This could indicate overfitting or suboptimal feature selection in the random approach. The stark contrast in trends highlights the importance of structured data selection (ActPRM) over random sampling in machine learning workflows.