## Chart: Training Reward and Clipping Fraction vs. Training Steps
### Overview
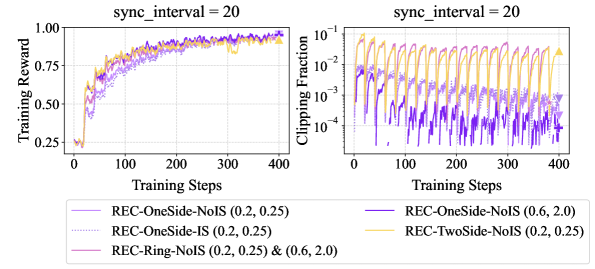
The image contains two line charts side-by-side. The left chart displays "Training Reward" versus "Training Steps," while the right chart shows "Clipping Fraction" versus "Training Steps." Both charts share the same x-axis ("Training Steps") and have "sync_interval = 20" at the top. The left chart has a linear y-axis, while the right chart has a logarithmic y-axis. Different colored lines represent different configurations (REC-OneSide-NoIS, REC-OneSide-IS, REC-Ring-NoIS, REC-TwoSide-NoIS) with varying parameters.
### Components/Axes
**Left Chart (Training Reward):**
* **Title:** sync\_interval = 20
* **X-axis:** Training Steps (0 to 400)
* **Y-axis:** Training Reward (0.25 to 1.00)
* Y-axis markers: 0.25, 0.50, 0.75, 1.00
* **Legend (bottom-left):**
* REC-OneSide-NoIS (0.2, 0.25) - solid light-purple line
* REC-OneSide-IS (0.2, 0.25) - dotted light-purple line
* REC-Ring-NoIS (0.2, 0.25) & (0.6, 2.0) - solid dark-purple line
**Right Chart (Clipping Fraction):**
* **Title:** sync\_interval = 20
* **X-axis:** Training Steps (0 to 400)
* **Y-axis:** Clipping Fraction (10<sup>-4</sup> to 10<sup>-1</sup>, logarithmic scale)
* Y-axis markers: 10^-4, 10^-3, 10^-2, 10^-1
* **Legend (bottom-right):**
* REC-OneSide-NoIS (0.6, 2.0) - solid dark-purple line
* REC-TwoSide-NoIS (0.2, 0.25) - solid light-yellow line
### Detailed Analysis
**Left Chart (Training Reward):**
* **REC-OneSide-NoIS (0.2, 0.25) (light-purple solid line):** Starts at approximately 0.25, increases rapidly to approximately 0.75 by step 100, then gradually increases to approximately 0.95 by step 400.
* **REC-OneSide-IS (0.2, 0.25) (light-purple dotted line):** Starts at approximately 0.25, increases rapidly to approximately 0.70 by step 100, then gradually increases to approximately 0.90 by step 400.
* **REC-Ring-NoIS (0.2, 0.25) & (0.6, 2.0) (dark-purple solid line):** Starts at approximately 0.25, increases rapidly to approximately 0.75 by step 100, then fluctuates around 0.95-1.00 by step 400.
**Right Chart (Clipping Fraction):**
* **REC-OneSide-NoIS (0.6, 2.0) (dark-purple solid line):** Starts at approximately 10<sup>-2</sup>, exhibits periodic drops and rises, generally decreasing over time to approximately 10<sup>-3</sup> by step 400. The line shows a saw-tooth pattern.
* **REC-TwoSide-NoIS (0.2, 0.25) (light-yellow solid line):** Starts at approximately 10<sup>-1</sup>, exhibits periodic drops and rises, generally decreasing over time to approximately 10<sup>-2</sup> by step 400. The line shows a saw-tooth pattern.
### Key Observations
* In the Training Reward chart, all configurations show a rapid increase in reward during the initial training steps, followed by a more gradual increase and stabilization.
* In the Clipping Fraction chart, both configurations exhibit periodic behavior, with the clipping fraction decreasing over time.
* The REC-TwoSide-NoIS (0.2, 0.25) configuration has a significantly higher clipping fraction than the REC-OneSide-NoIS (0.6, 2.0) configuration throughout the training process.
### Interpretation
The charts illustrate the training performance of different reinforcement learning configurations. The Training Reward chart indicates how well the agent is learning, while the Clipping Fraction chart provides insight into the stability and convergence of the training process. The periodic behavior in the Clipping Fraction chart suggests that the agent is periodically adjusting its policy, possibly due to the "sync_interval = 20" parameter. The lower clipping fraction for REC-OneSide-NoIS (0.6, 2.0) suggests that this configuration might be more stable or efficient than REC-TwoSide-NoIS (0.2, 0.25). The different lines in the Training Reward chart show that the different configurations converge to similar reward levels, but the rate of convergence and the final reward level may vary slightly.