\n
## Chart: Training Reward and Clipping Fraction vs. Training Steps
### Overview
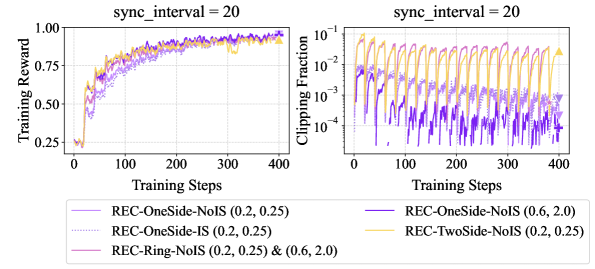
The image presents two charts side-by-side, both displaying data related to training progress. The left chart shows "Training Reward" against "Training Steps," while the right chart shows "Clipping Fraction" against "Training Steps." Both charts share the same x-axis (Training Steps) and have a common title indicating a `sync_interval = 20`. Four different training configurations are represented by different colored lines in both charts.
### Components/Axes
* **X-axis (Both Charts):** "Training Steps" ranging from 0 to 400, with gridlines at increments of 50.
* **Left Chart Y-axis:** "Training Reward" ranging from 0.0 to 1.0, with gridlines at increments of 0.25.
* **Right Chart Y-axis:** "Clipping Fraction" on a logarithmic scale, ranging from 10<sup>-1</sup> to 10<sup>-5</sup>, with gridlines at increments of 10<sup>-2</sup>, 10<sup>-3</sup>, and 10<sup>-4</sup>.
* **Legend (Bottom Center):** Lists the four training configurations and their corresponding line colors:
* REC-OneSide-NoIS (0.2, 0.25) - Purple Solid Line
* REC-OneSide-IS (0.2, 0.25) - Blue Dotted Line
* REC-Ring-NoIS (0.2, 0.25) & (0.6, 2.0) - Purple Dashed Line
* REC-TwoSide-NoIS (0.2, 0.25) - Yellow Solid Line
### Detailed Analysis
**Left Chart (Training Reward):**
* **REC-OneSide-NoIS (0.2, 0.25) (Purple Solid):** Starts at approximately 0.25 at step 0, rises sharply to around 0.75 by step 50, then plateaus around 0.85-0.95 for the remainder of the training steps.
* **REC-OneSide-IS (0.2, 0.25) (Blue Dotted):** Starts at approximately 0.25 at step 0, rises to around 0.65 by step 50, then continues to increase more slowly, reaching approximately 0.85-0.95 by step 400.
* **REC-Ring-NoIS (0.2, 0.25) & (0.6, 2.0) (Purple Dashed):** Starts at approximately 0.25 at step 0, rises rapidly to around 0.80 by step 50, then fluctuates between 0.80 and 0.95 for the remainder of the training steps.
* **REC-TwoSide-NoIS (0.2, 0.25) (Yellow Solid):** Starts at approximately 0.25 at step 0, rises quickly to around 0.75 by step 50, then continues to increase, reaching approximately 0.90-0.95 by step 400.
**Right Chart (Clipping Fraction):**
* **REC-OneSide-NoIS (0.2, 0.25) (Purple Solid):** Exhibits a periodic oscillation, starting around 0.01, dipping to approximately 0.001 at steps 50, 150, 250, and 350, and peaking around 0.01 at steps 25, 125, 225, and 325.
* **REC-OneSide-IS (0.2, 0.25) (Blue Dotted):** Also exhibits a periodic oscillation, but with a smaller amplitude than the purple solid line. It starts around 0.003, dips to approximately 0.0003 at steps 50, 150, 250, and 350, and peaks around 0.003 at steps 25, 125, 225, and 325.
* **REC-Ring-NoIS (0.2, 0.25) & (0.6, 2.0) (Purple Dashed):** Shows a similar oscillating pattern to the purple solid line, but with a slightly higher amplitude. It starts around 0.02, dips to approximately 0.002 at steps 50, 150, 250, and 350, and peaks around 0.02 at steps 25, 125, 225, and 325.
* **REC-TwoSide-NoIS (0.2, 0.25) (Yellow Solid):** Exhibits a periodic oscillation, starting around 0.005, dipping to approximately 0.0005 at steps 50, 150, 250, and 350, and peaking around 0.005 at steps 25, 125, 225, and 325.
### Key Observations
* All four configurations show increasing training reward over time, but the rate of increase varies.
* The "REC-OneSide-NoIS" configuration (purple solid) reaches a high reward relatively quickly but exhibits the largest oscillations in clipping fraction.
* The "REC-OneSide-IS" configuration (blue dotted) has a slower initial reward increase but a lower clipping fraction.
* The "REC-Ring-NoIS" configuration (purple dashed) shows a similar reward pattern to "REC-OneSide-NoIS" but with a slightly lower peak reward and a higher clipping fraction.
* The "REC-TwoSide-NoIS" configuration (yellow solid) demonstrates a steady increase in reward and a moderate clipping fraction.
* The clipping fraction oscillates periodically for all configurations, suggesting a cyclical pattern in gradient clipping.
### Interpretation
The charts demonstrate the training dynamics of four different reinforcement learning configurations. The "Training Reward" chart indicates how well each configuration is learning to achieve its objective, while the "Clipping Fraction" chart provides insight into the stability of the training process. A high clipping fraction suggests that gradients are frequently being clipped, which can indicate instability or a need for a smaller learning rate.
The differences in reward and clipping fraction between the configurations suggest that the choice of training parameters (NoIS vs. IS, OneSide vs. TwoSide, and the specific parameter values) significantly impacts both learning performance and training stability. The periodic oscillation in clipping fraction across all configurations suggests that the training process is subject to a cyclical pattern, potentially related to the update frequency or the nature of the environment. The `sync_interval = 20` likely influences this periodicity.
The fact that all configurations eventually achieve relatively high rewards suggests that the environment is learnable, but the optimal configuration depends on the desired trade-off between learning speed and training stability. The "REC-OneSide-NoIS" configuration appears to learn fastest but at the cost of higher instability (as indicated by the clipping fraction).