## Line Graphs: Training Reward and Clipping Fraction vs Training Steps
### Overview
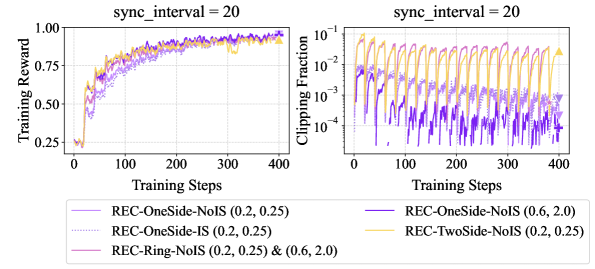
The image contains two side-by-side line graphs. The left graph plots **Training Reward** against **Training Steps**, while the right graph plots **Clipping Fraction** against **Training Steps**. Both graphs share the same x-axis (Training Steps: 0–400) and y-axis scales (logarithmic for Clipping Fraction). Three data series are compared across both graphs, differentiated by color and line style.
### Components/Axes
- **Left Graph (Training Reward)**:
- **Y-axis**: "Training Reward" (linear scale: 0.25–1.00).
- **X-axis**: "Training Steps" (0–400, increments of 100).
- **Legend**:
- **Solid Purple**: REC-OneSide-NoIS (0.2, 0.25).
- **Dotted Purple**: REC-OneSide-IS (0.2, 0.25).
- **Orange**: REC-Ring-NoIS (0.2, 0.25) & (0.6, 2.0).
- **Right Graph (Clipping Fraction)**:
- **Y-axis**: "Clipping Fraction" (logarithmic scale: 10⁻⁴–10⁻¹).
- **X-axis**: "Training Steps" (0–400, increments of 100).
- **Legend**:
- **Solid Purple**: REC-OneSide-NoIS (0.6, 2.0).
- **Orange**: REC-TwoSide-NoIS (0.2, 0.25).
### Detailed Analysis
#### Left Graph (Training Reward):
- **Solid Purple (REC-OneSide-NoIS (0.2, 0.25))**:
- Starts at ~0.25, rises sharply to ~0.75 by 100 steps, then plateaus near 1.00.
- Slight fluctuations but overall upward trend.
- **Dotted Purple (REC-OneSide-IS (0.2, 0.25))**:
- Similar trajectory to solid purple but with minor oscillations.
- Ends slightly below 1.00 (~0.95).
- **Orange (REC-Ring-NoIS (0.2, 0.25) & (0.6, 2.0))**:
- Starts at ~0.25, rises to ~0.85 by 100 steps, then plateaus near 0.95.
- Smoother curve with fewer fluctuations.
#### Right Graph (Clipping Fraction):
- **Solid Purple (REC-OneSide-NoIS (0.6, 2.0))**:
- Starts at ~10⁻³, decreases to ~10⁻⁴ by 100 steps, then stabilizes.
- Sharp initial drop, then minor oscillations.
- **Orange (REC-TwoSide-NoIS (0.2, 0.25))**:
- Starts at ~10⁻³, decreases to ~10⁻⁴ by 100 steps, then stabilizes.
- Slightly higher initial values than solid purple.
### Key Observations
1. **Training Reward**:
- All models improve over time, with REC-Ring-NoIS (orange) achieving the highest reward (~0.95) by 400 steps.
- REC-OneSide-NoIS (solid purple) and REC-OneSide-IS (dotted purple) perform similarly but slightly lower.
2. **Clipping Fraction**:
- Both models show a logarithmic decline, with REC-OneSide-NoIS (solid purple) achieving the lowest clipping fraction (~10⁻⁴) by 400 steps.
- REC-TwoSide-NoIS (orange) has slightly higher clipping fractions initially but converges to similar values.
3. **Parameter Impact**:
- Higher parameters (e.g., 0.6, 2.0) in REC-OneSide-NoIS correlate with better performance in both metrics.
### Interpretation
The data suggests that increasing the parameters (e.g., 0.6, 2.0) in the REC-OneSide-NoIS model improves both training reward and reduces clipping fraction, indicating more stable and efficient learning. The REC-Ring-NoIS model (orange) balances performance across both metrics, while the REC-OneSide-IS model (dotted purple) shows minor oscillations but comparable results to REC-OneSide-NoIS. The logarithmic scale for clipping fraction highlights the exponential decay in errors, emphasizing the importance of minimizing clipping for robust training.