## Scatter Plot: IDH-Wildtype Glioblastoma Gene Ranking Shifts
### Overview
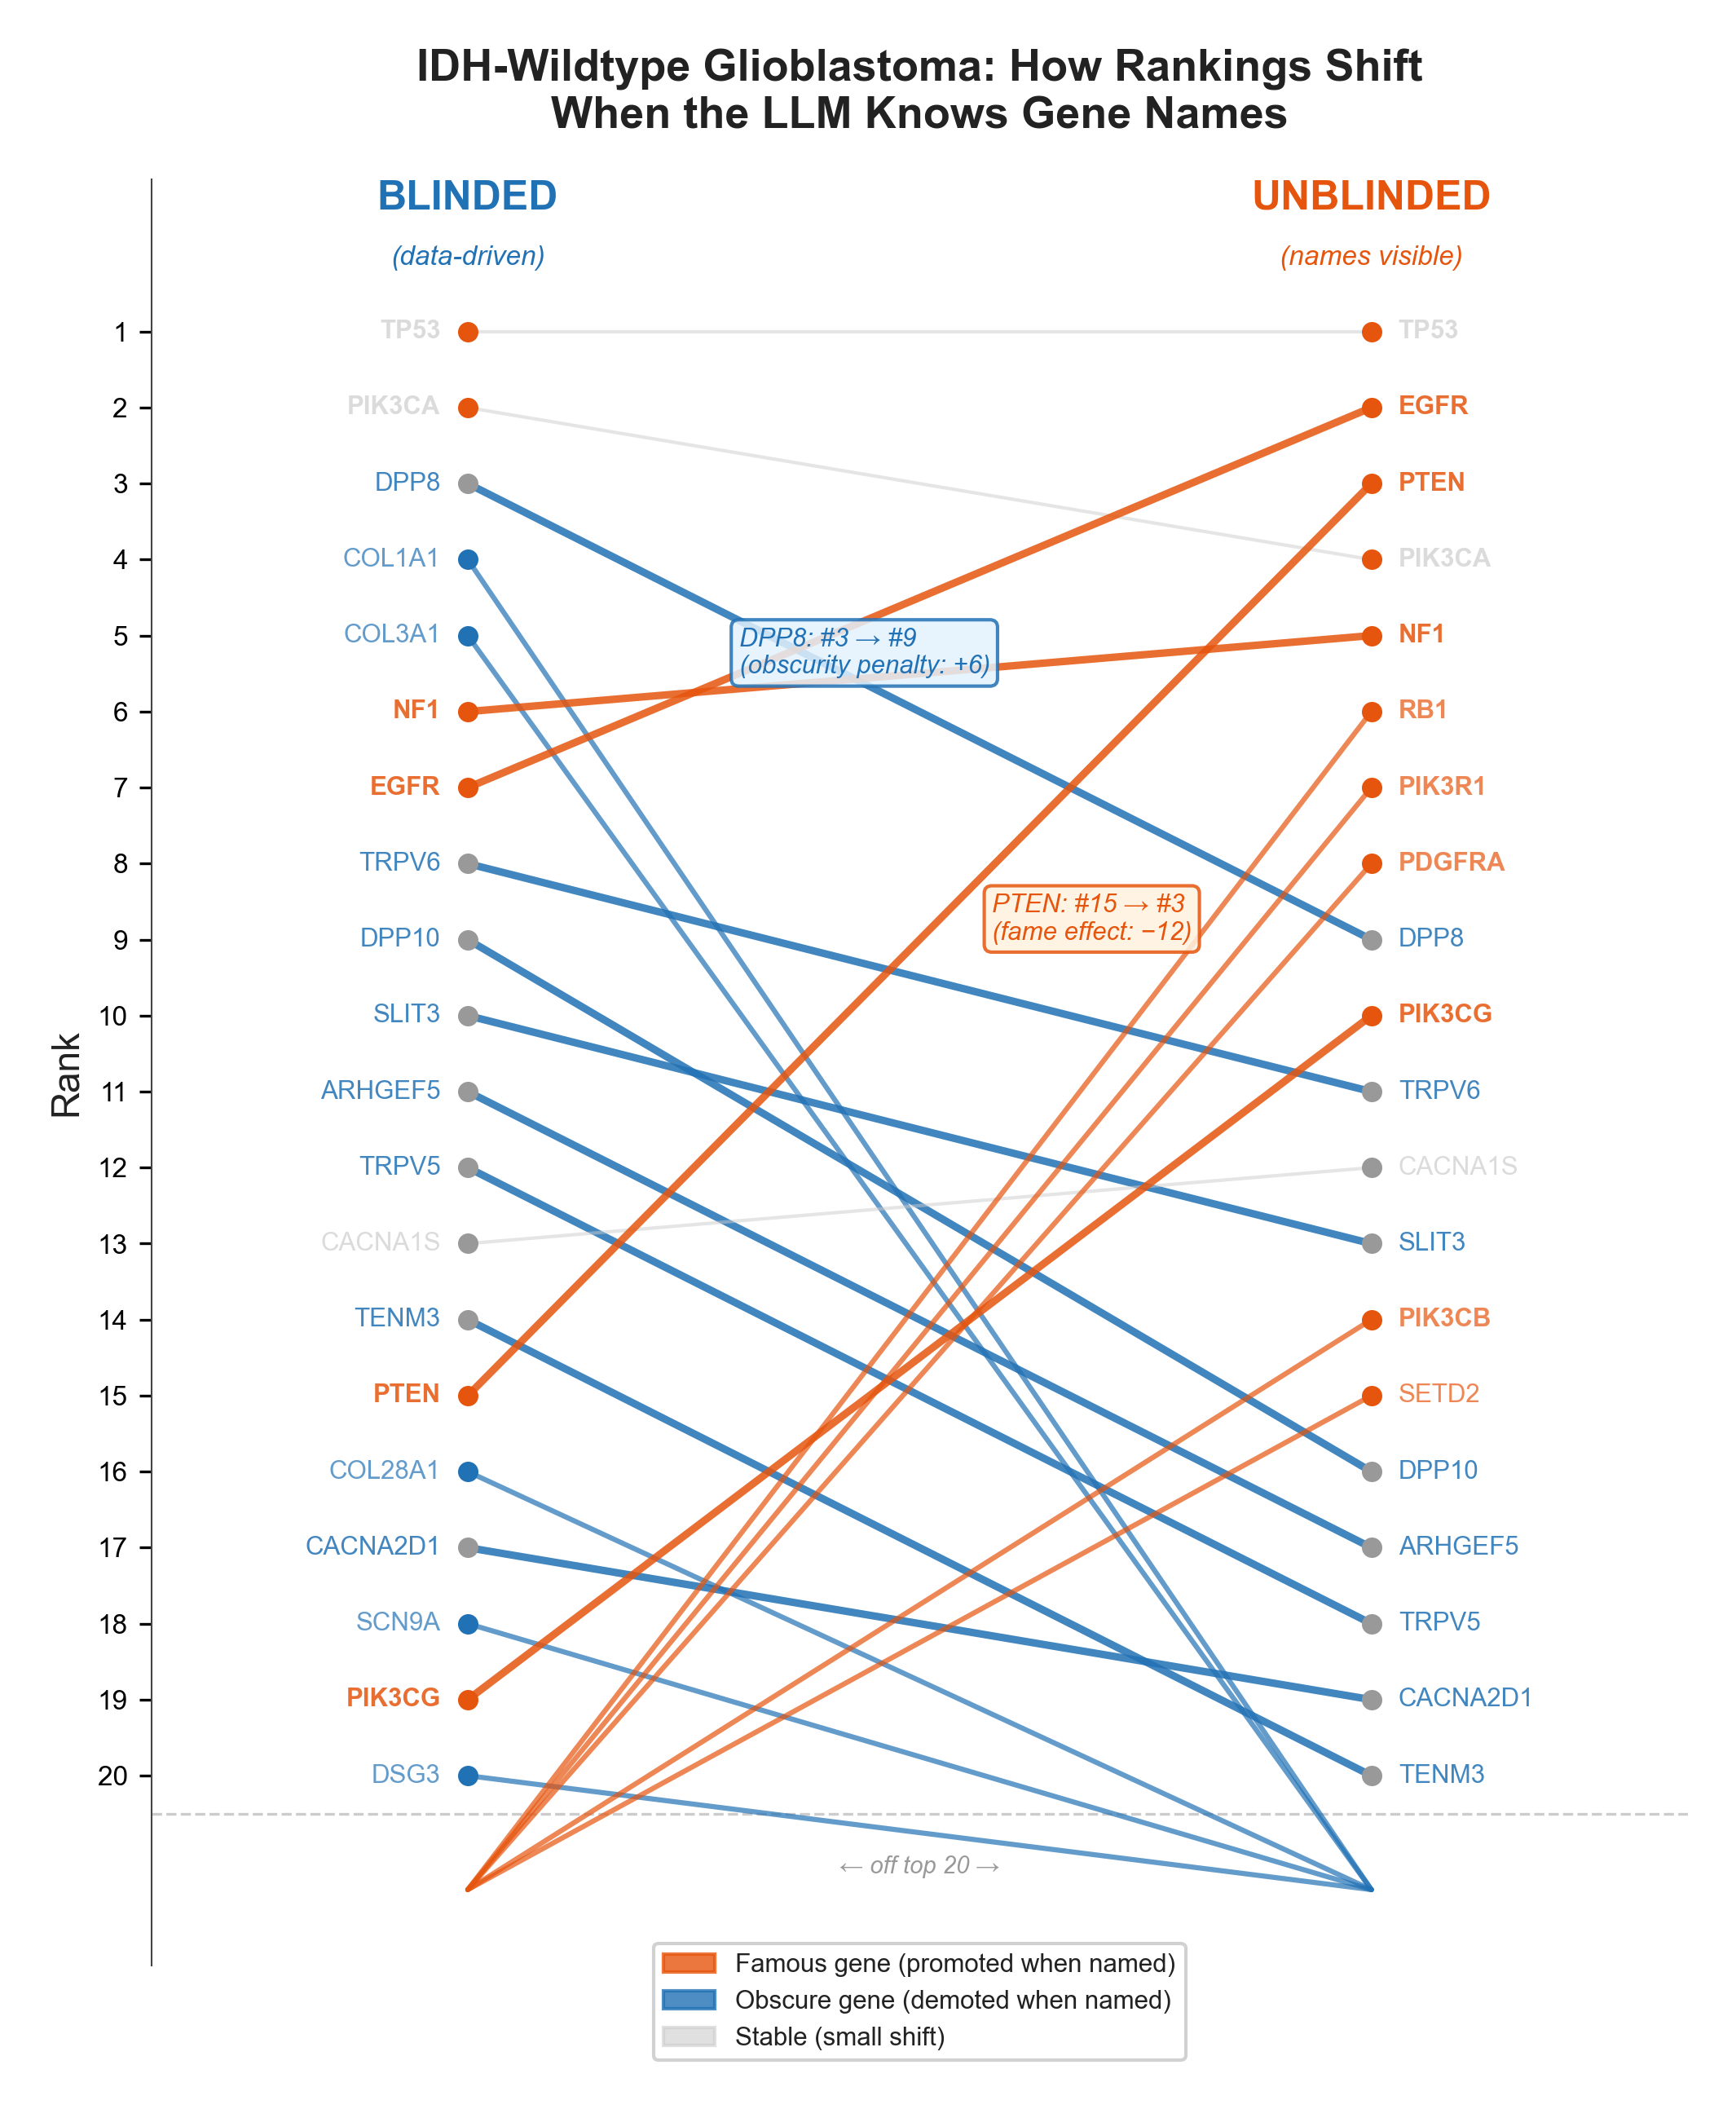
This scatter plot visualizes how gene rankings shift in IDH-wildtype glioblastoma when gene names are revealed (unblinded) versus when they are obscured (blinded). The chart compares 20 genes across two conditions, with lines connecting blinded/unblinded rankings and annotations explaining notable shifts.
### Components/Axes
- **Y-axis**: "Rank" (1–20, inverted scale: 1=top, 20=bottom)
- **X-axis**: "off top 20" (positioning for genes outside top 20)
- **Legend** (bottom center):
- **Orange**: Famous gene (promoted when named)
- **Blue**: Obscure gene (demoted when named)
- **Gray**: Stable (small shift)
- **Annotations**:
- "DPP8: #3 → #9 (obscurity penalty: +6)"
- "PTEN: #15 → #3 (fame effect: –12)"
### Detailed Analysis
#### Blinded (Blue Lines)
1. **Top-ranked genes**:
- TP53 (#1)
- PIK3CA (#2)
- DPP8 (#3)
- COL1A1 (#4)
- COL3A1 (#5)
2. **Mid-ranked genes**:
- NF1 (#6)
- EGFR (#7)
- TRPV6 (#8)
- DPP10 (#9)
- SLIT3 (#10)
3. **Lower-ranked genes**:
- ARHGEF5 (#11)
- TRPV5 (#12)
- CACNA1S (#13)
- TENM3 (#14)
- PTEN (#15)
- COL28A1 (#16)
- CACNA2D1 (#17)
- SCN9A (#18)
- PIK3CG (#19)
- DSG3 (#20)
#### Unblinded (Orange Lines)
1. **Top-ranked genes**:
- TP53 (#1)
- EGFR (#2)
- PTEN (#3)
- NF1 (#4)
- RB1 (#5)
2. **Mid-ranked genes**:
- PIK3CA (#6)
- PDGFRA (#7)
- PIK3R1 (#8)
- PIK3CG (#9)
- SETD2 (#10)
3. **Lower-ranked genes**:
- DPP8 (#11)
- TRPV6 (#12)
- CACNA1S (#13)
- SLIT3 (#14)
- ARHGEF5 (#15)
- DPP10 (#16)
- TENM3 (#17)
- CACNA2D1 (#18)
- TRPV5 (#19)
- SCN9A (#20)
### Key Observations
1. **Fame Effect**:
- PTEN jumps from #15 (blinded) to #3 (unblinded) due to "fame effect" (–12 rank shift).
- EGFR rises from #7 to #2 (+5 shift).
2. **Obscurity Penalty**:
- DPP8 drops from #3 to #9 (+6 shift) when named.
- PIK3CG falls from #19 to #9 (+10 shift).
3. **Stability**:
- TP53 and PIK3CA remain in top 2 with minimal shifts.
- CACNA1S and SLIT3 show small rank changes (<2 positions).
### Interpretation
The chart reveals a clear bias in gene ranking influenced by name recognition:
- **Famous genes** (e.g., EGFR, PTEN) gain prominence when unblinded, likely due to existing literature or clinical relevance.
- **Obscure genes** (e.g., DPP8, PIK3CG) lose visibility when named, suggesting underrepresentation in prior studies.
- Stable genes (gray lines) represent core biomarkers with consistent recognition.
This pattern highlights how naming conventions and prior knowledge may skew genomic research priorities, potentially overlooking less-studied but biologically significant genes. The "fame effect" and "obscurity penalty" annotations underscore the need for blinded analysis to mitigate cognitive biases in scientific interpretation.