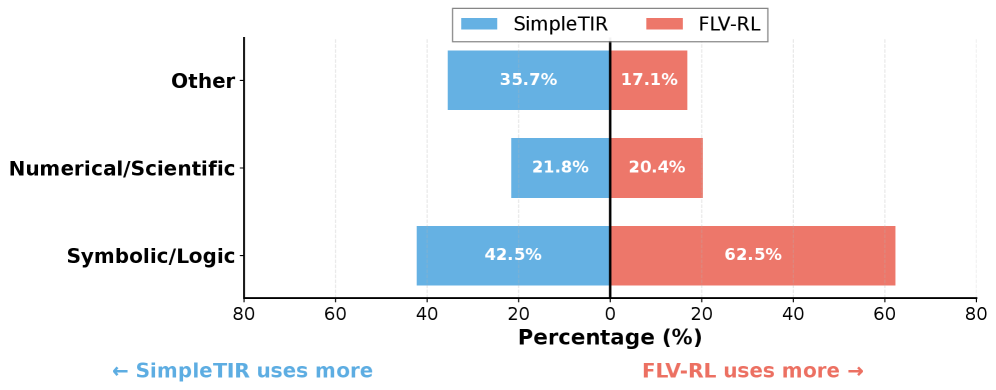
\n
## Diverging Bar Chart: Comparison of SimpleTIR vs. FLV-RL Usage by Task Category
### Overview
The image is a horizontal diverging bar chart comparing the percentage usage of two methods, **SimpleTIR** and **FLV-RL**, across three distinct task categories. The chart is designed to show which method is used more for each category, with SimpleTIR's data extending to the left of a central zero line and FLV-RL's data extending to the right.
### Components/Axes
* **Chart Type:** Horizontal diverging bar chart.
* **Y-Axis (Vertical):** Lists three task categories. From top to bottom:
1. `Other`
2. `Numerical/Scientific`
3. `Symbolic/Logic`
* **X-Axis (Horizontal):** Labeled `Percentage (%)`. It is a bidirectional axis centered at 0.
* The left side (negative direction) is labeled with markers: `80`, `60`, `40`, `20`, `0`.
* The right side (positive direction) is labeled with markers: `0`, `20`, `40`, `60`, `80`.
* **Legend:** Positioned at the top center of the chart.
* A blue square corresponds to `SimpleTIR`.
* A red/salmon square corresponds to `FLV-RL`.
* **Directional Labels:** Located below the x-axis.
* Left side (blue text): `← SimpleTIR uses more`
* Right side (red text): `FLV-RL uses more →`
### Detailed Analysis
The chart presents the following data points for each category, showing the percentage of usage for each method:
1. **Category: Other** (Top row)
* **SimpleTIR (Blue Bar, Left):** The bar extends left to approximately the 35.7% mark. The value `35.7%` is printed inside the bar.
* **FLV-RL (Red Bar, Right):** The bar extends right to approximately the 17.1% mark. The value `17.1%` is printed inside the bar.
* **Trend:** SimpleTIR is used more than twice as often as FLV-RL in the "Other" category.
2. **Category: Numerical/Scientific** (Middle row)
* **SimpleTIR (Blue Bar, Left):** The bar extends left to approximately the 21.8% mark. The value `21.8%` is printed inside the bar.
* **FLV-RL (Red Bar, Right):** The bar extends right to approximately the 20.4% mark. The value `20.4%` is printed inside the bar.
* **Trend:** Usage is nearly balanced, with SimpleTIR having a very slight lead (a difference of ~1.4 percentage points).
3. **Category: Symbolic/Logic** (Bottom row)
* **SimpleTIR (Blue Bar, Left):** The bar extends left to approximately the 42.5% mark. The value `42.5%` is printed inside the bar.
* **FLV-RL (Red Bar, Right):** The bar extends right to approximately the 62.5% mark. The value `62.5%` is printed inside the bar.
* **Trend:** FLV-RL is used significantly more than SimpleTIR in this category, with a 20 percentage point difference.
### Key Observations
* **Dominant Category for FLV-RL:** The "Symbolic/Logic" category shows the strongest performance for FLV-RL, where it is used substantially more (62.5%) than SimpleTIR (42.5%).
* **Balanced Category:** The "Numerical/Scientific" category shows the most balanced usage between the two methods, with percentages very close to each other (21.8% vs. 20.4%).
* **SimpleTIR's Stronghold:** SimpleTIR has its highest usage percentage in the "Symbolic/Logic" category (42.5%), but is still outpaced by FLV-RL there. Its second-highest usage is in the "Other" category (35.7%), where it clearly dominates FLV-RL.
* **Overall Pattern:** The chart suggests a specialization: FLV-RL appears to be the preferred method for Symbolic/Logic tasks, while SimpleTIR is more commonly applied to tasks categorized as "Other" and is competitive in Numerical/Scientific tasks.
### Interpretation
This chart visualizes a comparative analysis of two technical methods (SimpleTIR and FLV-RL) across different problem domains. The data suggests that the choice between these methods is highly dependent on the task type.
* **Task-Specific Efficacy:** The significant disparity in the "Symbolic/Logic" category implies that FLV-RL may have architectural or algorithmic advantages for tasks involving formal logic, symbolic reasoning, or structured problem-solving. Conversely, SimpleTIR's advantage in the "Other" category suggests it may be more versatile or better suited for a broader, less-defined set of tasks that don't fit neatly into the numerical or symbolic categories.
* **Methodological Complementarity:** The near-parity in "Numerical/Scientific" tasks indicates that for problems involving calculations, data analysis, or scientific modeling, both methods are viable options, and the choice might depend on other factors like computational cost, ease of implementation, or specific sub-domain requirements.
* **Investigative Insight:** A researcher or engineer viewing this chart would conclude that deploying FLV-RL for logic-heavy applications is likely beneficial, while SimpleTIR could be a strong default or specialist tool for miscellaneous ("Other") problems. The balanced performance in numerical tasks warrants further investigation into secondary metrics (like accuracy or speed) to make a definitive choice. The chart effectively argues against a one-size-fits-all approach, promoting a strategy of selecting the method based on the problem's fundamental nature.