## Heatmap: Classification Accuracies
### Overview
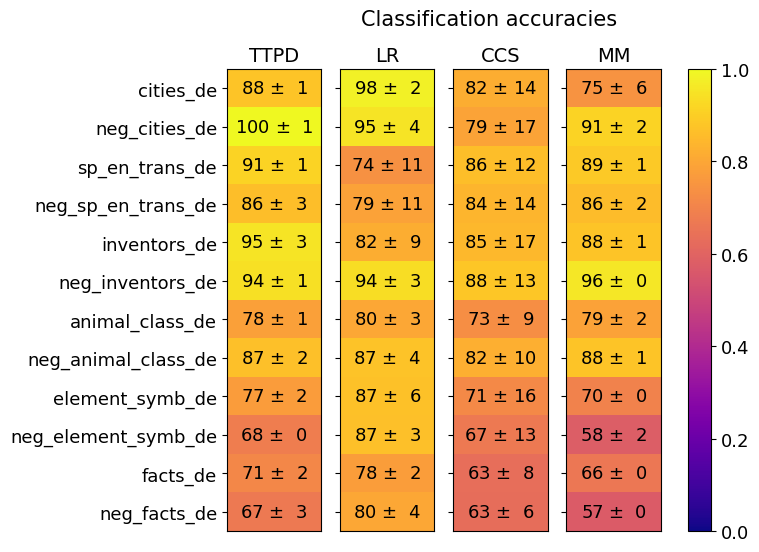
The image is a heatmap displaying the classification accuracies of four different models (TTPD, LR, CCS, and MM) across various German language datasets. The color intensity represents the accuracy score, ranging from dark blue (0.0) to bright yellow (1.0). Each cell contains the accuracy score and its associated uncertainty (± value).
### Components/Axes
* **Title:** Classification accuracies
* **Columns (Models):** TTPD, LR, CCS, MM
* **Rows (Datasets):** cities\_de, neg\_cities\_de, sp\_en\_trans\_de, neg\_sp\_en\_trans\_de, inventors\_de, neg\_inventors\_de, animal\_class\_de, neg\_animal\_class\_de, element\_symb\_de, neg\_element\_symb\_de, facts\_de, neg\_facts\_de
* **Colorbar:** Ranges from 0.0 (dark blue) to 1.0 (bright yellow), representing the classification accuracy score.
### Detailed Analysis
Here's a breakdown of the accuracy scores for each model and dataset:
* **cities\_de:**
* TTPD: 88 ± 1
* LR: 98 ± 2
* CCS: 82 ± 14
* MM: 75 ± 6
* **neg\_cities\_de:**
* TTPD: 100 ± 1
* LR: 95 ± 4
* CCS: 79 ± 17
* MM: 91 ± 2
* **sp\_en\_trans\_de:**
* TTPD: 91 ± 1
* LR: 74 ± 11
* CCS: 86 ± 12
* MM: 89 ± 1
* **neg\_sp\_en\_trans\_de:**
* TTPD: 86 ± 3
* LR: 79 ± 11
* CCS: 84 ± 14
* MM: 86 ± 2
* **inventors\_de:**
* TTPD: 95 ± 3
* LR: 82 ± 9
* CCS: 85 ± 17
* MM: 88 ± 1
* **neg\_inventors\_de:**
* TTPD: 94 ± 1
* LR: 94 ± 3
* CCS: 88 ± 13
* MM: 96 ± 0
* **animal\_class\_de:**
* TTPD: 78 ± 1
* LR: 80 ± 3
* CCS: 73 ± 9
* MM: 79 ± 2
* **neg\_animal\_class\_de:**
* TTPD: 87 ± 2
* LR: 87 ± 4
* CCS: 82 ± 10
* MM: 88 ± 1
* **element\_symb\_de:**
* TTPD: 77 ± 2
* LR: 87 ± 6
* CCS: 71 ± 16
* MM: 70 ± 0
* **neg\_element\_symb\_de:**
* TTPD: 68 ± 0
* LR: 87 ± 3
* CCS: 67 ± 13
* MM: 58 ± 2
* **facts\_de:**
* TTPD: 71 ± 2
* LR: 78 ± 2
* CCS: 63 ± 8
* MM: 66 ± 0
* **neg\_facts\_de:**
* TTPD: 67 ± 3
* LR: 80 ± 4
* CCS: 63 ± 6
* MM: 57 ± 0
### Key Observations
* LR generally performs well across all datasets, often achieving high accuracy scores.
* CCS has the highest uncertainty (± values) in its accuracy scores compared to other models.
* TTPD shows high accuracy on "neg\_cities\_de" (100 ± 1).
* MM shows the lowest accuracy on "neg\_facts\_de" (57 ± 0).
### Interpretation
The heatmap provides a visual comparison of the classification performance of four different models on a range of German language datasets. The color-coding allows for quick identification of the best-performing models for each dataset. The uncertainty values provide insight into the stability and reliability of each model's performance. The data suggests that LR is a robust model, while CCS may be more sensitive to the specific dataset. The "neg\_" prefixed datasets likely represent negative examples or counterfactuals, and the varying performance across these datasets highlights the models' ability to handle such cases.