## Heatmap: Classification Accuracies
### Overview
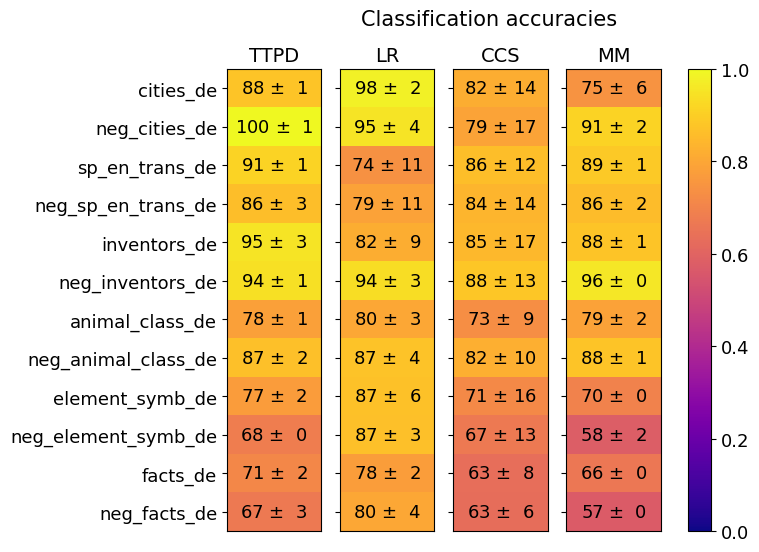
This image presents a heatmap displaying classification accuracies for various datasets and models. The heatmap uses a color gradient to represent accuracy values, ranging from 0.0 (dark blue) to 1.0 (bright yellow). The data is organized in a table format, with datasets listed on the y-axis and models on the x-axis. Each cell in the heatmap represents the accuracy of a specific model on a specific dataset, along with a standard deviation.
### Components/Axes
* **Y-axis (Datasets):**
* cities\_de
* neg\_cities\_de
* sp\_en\_trans\_de
* neg\_sp\_en\_trans\_de
* inventors\_de
* neg\_inventors\_de
* animal\_class\_de
* neg\_animal\_class\_de
* element\_symb\_de
* neg\_element\_symb\_de
* facts\_de
* neg\_facts\_de
* **X-axis (Models):**
* TTPD
* LR
* CCS
* MM
* **Color Scale (Legend):** Located on the right side of the heatmap, ranging from 0.0 (dark blue) to 1.0 (bright yellow).
* **Title:** "Classification accuracies" positioned at the top-center of the heatmap.
### Detailed Analysis
The heatmap displays accuracy values in the format "Mean ± Standard Deviation". I will analyze each row (dataset) and column (model) to extract the data.
* **cities\_de:**
* TTPD: 88 ± 1
* LR: 98 ± 2
* CCS: 82 ± 14
* MM: 75 ± 6
* **neg\_cities\_de:**
* TTPD: 100 ± 1
* LR: 95 ± 4
* CCS: 79 ± 17
* MM: 91 ± 2
* **sp\_en\_trans\_de:**
* TTPD: 91 ± 1
* LR: 74 ± 11
* CCS: 86 ± 12
* MM: 89 ± 1
* **neg\_sp\_en\_trans\_de:**
* TTPD: 86 ± 3
* LR: 79 ± 11
* CCS: 84 ± 14
* MM: 86 ± 2
* **inventors\_de:**
* TTPD: 95 ± 3
* LR: 82 ± 9
* CCS: 85 ± 17
* MM: 88 ± 1
* **neg\_inventors\_de:**
* TTPD: 94 ± 1
* LR: 94 ± 3
* CCS: 88 ± 13
* MM: 96 ± 0
* **animal\_class\_de:**
* TTPD: 78 ± 1
* LR: 80 ± 3
* CCS: 73 ± 9
* MM: 79 ± 2
* **neg\_animal\_class\_de:**
* TTPD: 87 ± 2
* LR: 87 ± 4
* CCS: 82 ± 10
* MM: 88 ± 1
* **element\_symb\_de:**
* TTPD: 77 ± 2
* LR: 87 ± 6
* CCS: 71 ± 16
* MM: 70 ± 0
* **neg\_element\_symb\_de:**
* TTPD: 68 ± 0
* LR: 87 ± 3
* CCS: 67 ± 13
* MM: 58 ± 2
* **facts\_de:**
* TTPD: 71 ± 2
* LR: 78 ± 2
* CCS: 63 ± 8
* MM: 66 ± 0
* **neg\_facts\_de:**
* TTPD: 67 ± 3
* LR: 80 ± 4
* CCS: 63 ± 6
* MM: 57 ± 0
### Key Observations
* **LR consistently performs well:** The LR model generally achieves high accuracy across most datasets, often exceeding 90%.
* **TTPD shows variability:** TTPD's performance varies significantly depending on the dataset. It performs exceptionally well on 'neg\_cities\_de' (100 ± 1) but lower on 'neg\_element\_symb\_de' (68 ± 0).
* **CCS and MM generally lower accuracy:** CCS and MM models tend to have lower accuracy scores compared to LR and, in some cases, TTPD.
* **Negative datasets:** The "neg\_" prefixed datasets generally have slightly different accuracy profiles compared to their non-negative counterparts.
* **Low accuracy for MM on several datasets:** MM consistently shows the lowest accuracy for 'element\_symb\_de', 'neg\_element\_symb\_de', 'facts\_de', and 'neg\_facts\_de', often around 57-70%.
### Interpretation
This heatmap provides a comparative analysis of the performance of four classification models (TTPD, LR, CCS, and MM) on twelve different datasets, all seemingly in the German language ("\_de" suffix). The "neg\_" datasets likely represent negative examples or adversarial data.
The consistently high performance of the LR model suggests it is a robust classifier for these datasets. The variability in TTPD's performance indicates it may be more sensitive to the specific characteristics of each dataset. The lower accuracy of CCS and MM suggests they may be less effective for these particular classification tasks.
The differences in accuracy between the original and negative datasets highlight the importance of considering adversarial examples when evaluating model performance. The low accuracy of MM on certain datasets could indicate a weakness in its ability to generalize to those specific types of data.
The color gradient effectively visualizes the performance differences, allowing for quick identification of the best and worst performing models for each dataset. The inclusion of standard deviation provides a measure of the uncertainty associated with each accuracy estimate. This data could be used to select the most appropriate model for a given task or to identify areas where further model development is needed.