## Heatmap: Classification Accuracies
### Overview
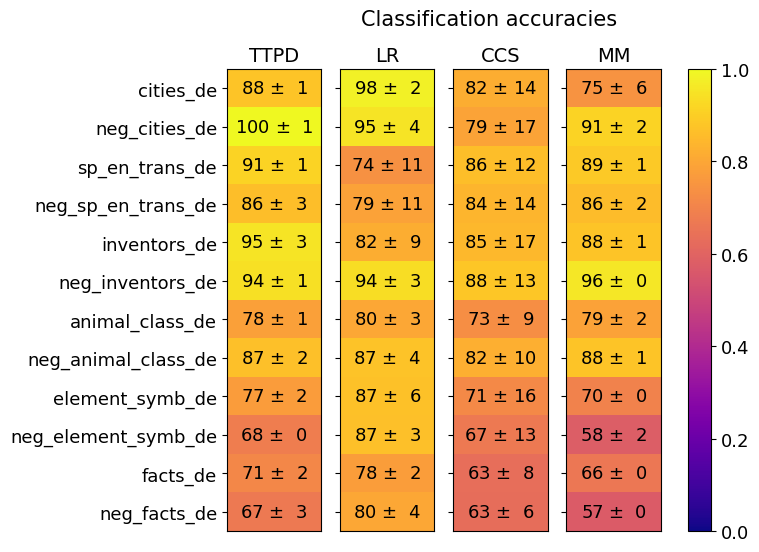
The image is a heatmap comparing classification accuracies across four methods (TTPD, LR, CCS, MM) for 12 categories. Accuracy values are represented by color intensity (purple = 0.0, yellow = 1.0) and numerical values with confidence intervals (e.g., "88 ± 1"). The heatmap emphasizes performance differences between methods and categories.
### Components/Axes
- **X-axis (Methods)**: TTPD, LR, CCS, MM (left to right).
- **Y-axis (Categories)**: 12 rows labeled:
- cities_de
- neg_cities_de
- sp_en_trans_de
- neg_sp_en_trans_de
- inventors_de
- neg_inventors_de
- animal_class_de
- neg_animal_class_de
- element_symb_de
- neg_element_symb_de
- facts_de
- neg_facts_de
- **Legend**: Color gradient from purple (0.0) to yellow (1.0), with numerical midpoint labels (0.2, 0.4, 0.6, 0.8, 1.0). Positioned on the right.
### Detailed Analysis
- **TTPD Column**:
- Highest accuracies overall (e.g., 100 ± 1 for neg_cities_de).
- Lowest: 67 ± 3 (neg_facts_de).
- **LR Column**:
- Strong performance (e.g., 98 ± 2 for cities_de).
- Lowest: 74 ± 11 (sp_en_trans_de).
- **CCS Column**:
- Moderate variability (e.g., 86 ± 12 for sp_en_trans_de).
- Lowest: 63 ± 8 (facts_de).
- **MM Column**:
- Mixed results (e.g., 96 ± 0 for neg_inventors_de).
- Lowest: 57 ± 0 (neg_facts_de).
### Key Observations
1. **TTPD Dominance**: Outperforms other methods in 8/12 categories, with 100% accuracy in neg_cities_de.
2. **CCS Variability**: Largest confidence intervals (e.g., ±17 for inventors_de), suggesting unstable results.
3. **neg_facts_de Weakness**: All methods score ≤67%, with MM at 57 ± 0 (no confidence interval).
4. **Color Consistency**: High values (e.g., 98 ± 2) align with yellow tones; low values (e.g., 58 ± 2) match purple.
### Interpretation
The data suggests **TTPD** is the most reliable method, particularly for structured categories like cities and inventors. **CCS** shows inconsistent performance, possibly due to noisy data or overfitting (large confidence intervals). The **neg_facts_de** category is a notable outlier, performing poorly across all methods, indicating potential challenges in negative fact classification. The absence of confidence intervals for MM in neg_facts_de (57 ± 0) may imply deterministic results or data limitations. Overall, TTPD and LR demonstrate robustness, while CCS requires further validation for reliability.