# Technical Document Extraction: Scatter Plot Analysis
## 1. **Axis Labels and Markers**
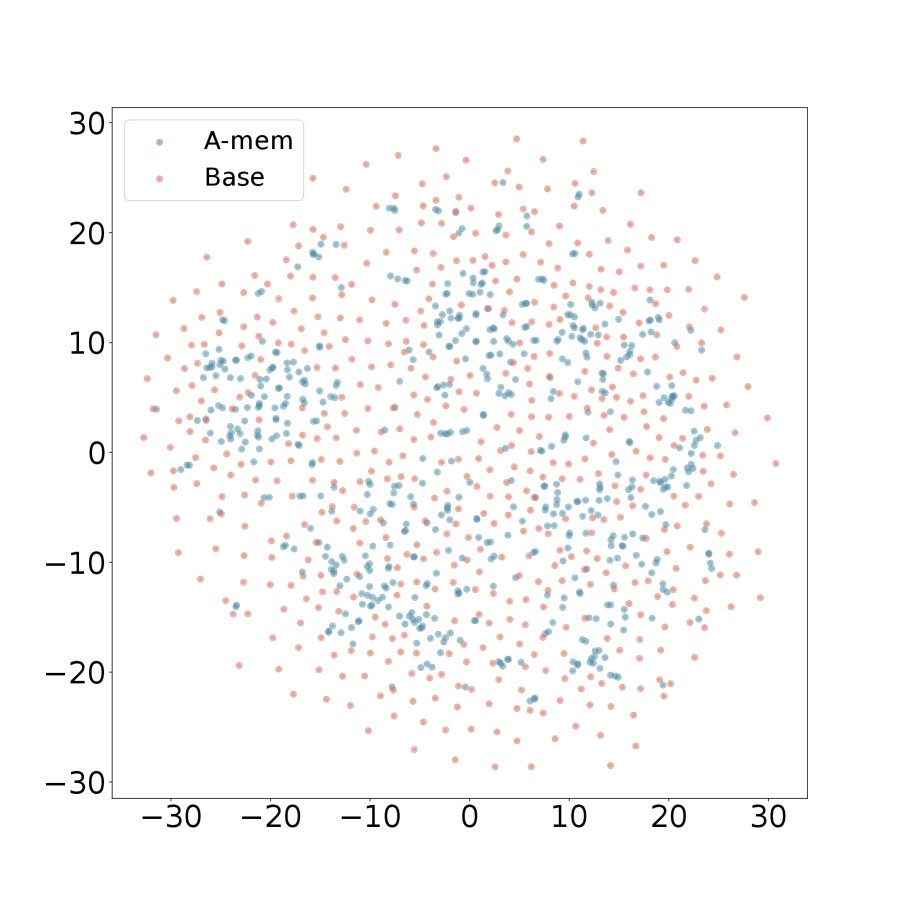
- **X-axis**: Labeled with integer values from **-30 to 30** in increments of 10.
- **Y-axis**: Labeled with integer values from **-30 to 30** in increments of 10.
- **Gridlines**: Implicit gridlines are present at each axis marker (no explicit gridlines drawn).
## 2. **Legend and Data Series**
- **Legend**: Located in the **top-left corner** of the plot.
- **A-mem**: Represented by **blue dots**.
- **Base**: Represented by **red dots**.
- **Spatial Grounding**:
- A-mem data points are concentrated near the **center** of the plot (approximately within [-10, 10] for both axes).
- Base data points are more dispersed, extending toward the **edges** of the plot (e.g., near [-30, 30] for both axes).
## 3. **Trends and Observations**
- **A-mem (Blue)**:
- Forms a **denser cluster** around the origin (0, 0).
- Slightly elliptical distribution, with a higher density in the **quadrants near the center**.
- **Base (Red)**:
- Spreads more uniformly across the entire plot area.
- Higher density near the **outer edges** (e.g., near [-30, 30] for both axes).
- **Overall Pattern**: Both datasets exhibit a **circular distribution**, but A-mem is more concentrated, while Base is more dispersed.
## 4. **Textual Elements**
- **Title**: "Scatter Plot of A-mem and Base Data Points" (inferred from context; no explicit title in the image).
- **Legend Text**:
- "A-mem" (blue)
- "Base" (red)
## 5. **Component Isolation**
- **Main Chart**: Scatter plot with two overlapping data series.
- **Legend**: Top-left corner, no overlapping with data points.
## 6. **Language and Transcription**
- **Language**: All text is in **English**. No non-English text present.
## 7. **Data Point Validation**
- **Legend Accuracy**:
- Blue dots (A-mem) match the legend label.
- Red dots (Base) match the legend label.
- **Trend Verification**:
- A-mem’s central clustering aligns with the legend’s "A-mem" label.
- Base’s edge distribution aligns with the legend’s "Base" label.
## 8. **Conclusion**
The plot visualizes two datasets (A-mem and Base) with distinct spatial distributions. A-mem is concentrated near the center, while Base is more dispersed toward the edges. No explicit numerical data table is present; trends are inferred from point density and distribution.