## Scatter Plots: Final-round Accuracy vs. L2 Distance from Prior Mean
### Overview
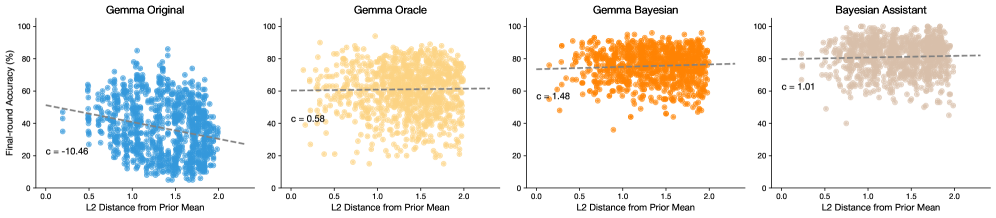
The image presents four scatter plots, each representing a different model: Gemma Original, Gemma Oracle, Gemma Bayesian, and Bayesian Assistant. Each plot visualizes the relationship between "Final-round Accuracy (%)" on the y-axis and "L2 Distance from Prior Mean" on the x-axis. A dashed line is fitted to each scatter plot, and the correlation coefficient 'c' is displayed for each model.
### Components/Axes
* **X-axis (all plots):** L2 Distance from Prior Mean (Scale: 0.0 to 2.0, approximately)
* **Y-axis (all plots):** Final-round Accuracy (%) (Scale: 0 to 100, approximately)
* **Plots (from left to right):**
* Gemma Original (Data points are blue)
* Gemma Oracle (Data points are light orange)
* Gemma Bayesian (Data points are orange)
* Bayesian Assistant (Data points are light brown/grey)
* **Correlation Line (all plots):** Dashed black line representing the linear correlation.
* **Correlation Coefficient (all plots):** Value 'c' displayed near the bottom-right of each plot.
### Detailed Analysis or Content Details
**1. Gemma Original (Blue):**
* Trend: The data points show a weak negative correlation. As the L2 Distance from Prior Mean increases, the Final-round Accuracy tends to decrease slightly.
* Correlation Coefficient (c): -10.46
* Data Distribution: Points are scattered, with a concentration of points between 20% and 80% accuracy, and L2 distances ranging from 0.0 to 2.0.
**2. Gemma Oracle (Light Orange):**
* Trend: The data points show a weak positive correlation. As the L2 Distance from Prior Mean increases, the Final-round Accuracy tends to increase slightly.
* Correlation Coefficient (c): 0.58
* Data Distribution: Points are more spread out than Gemma Original, with a wider range of accuracy values (from approximately 20% to 95%) and L2 distances (0.0 to 2.0).
**3. Gemma Bayesian (Orange):**
* Trend: The data points show a strong positive correlation. As the L2 Distance from Prior Mean increases, the Final-round Accuracy tends to increase significantly.
* Correlation Coefficient (c): 1.48
* Data Distribution: Points are clustered along a diagonal line, indicating a strong relationship between the two variables. Accuracy values range from approximately 40% to 100%, and L2 distances range from 0.0 to 2.0.
**4. Bayesian Assistant (Light Brown/Grey):**
* Trend: The data points show a weak positive correlation. As the L2 Distance from Prior Mean increases, the Final-round Accuracy tends to increase slightly.
* Correlation Coefficient (c): 1.01
* Data Distribution: Points are widely scattered, with a concentration of points between 60% and 90% accuracy, and L2 distances ranging from 0.0 to 2.0.
### Key Observations
* Gemma Bayesian exhibits the strongest positive correlation between L2 Distance from Prior Mean and Final-round Accuracy.
* Gemma Original exhibits a negative correlation, suggesting that greater distance from the prior mean leads to lower accuracy.
* Gemma Oracle and Bayesian Assistant show weak positive correlations.
* The correlation coefficients vary significantly across the models, indicating different relationships between the two variables.
### Interpretation
The plots demonstrate how different models respond to variations in their distance from a prior mean. A positive correlation suggests that moving further from the prior mean leads to higher accuracy, potentially indicating that the model is learning and adapting. A negative correlation suggests the opposite, that deviating from the prior mean degrades performance. The strength of the correlation, as indicated by the 'c' value, quantifies the degree of this relationship.
The Gemma Bayesian model's strong positive correlation suggests it benefits significantly from exploring solutions further from its initial prior. Conversely, the Gemma Original model's negative correlation suggests it performs best when staying close to its prior. The Gemma Oracle and Bayesian Assistant models show more moderate responses.
These differences could be due to variations in model architecture, training data, or the specific task being performed. The plots provide valuable insights into the behavior of each model and how they leverage prior knowledge during the learning process. The 'c' values are not standard correlation coefficients (ranging from -1 to 1), but rather a scaling factor specific to this visualization, indicating the slope of the fitted line.