## Scatter Plots: Final-round Accuracy vs L2 Distance from Prior Mean
### Overview
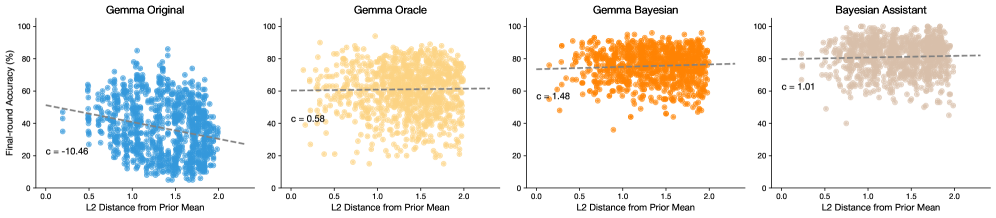
The image contains four scatter plots comparing final-round accuracy (y-axis) to L2 distance from prior mean (x-axis) for different models or conditions. Each plot uses a distinct color scheme and includes a dashed reference line labeled with a "c" value. The plots are arranged horizontally, with legends positioned to the right of each plot.
### Components/Axes
- **X-axis**: "L2 Distance from Prior Mean" (range: 0.0 to 2.0)
- **Y-axis**: "Final-round Accuracy (%)" (range: 0 to 100)
- **Legends**: Positioned right-aligned, matching the color of data points in each plot
- **Dashed Lines**: Labeled with "c = [value]" (e.g., "c = -10.46"), positioned diagonally across plots
### Detailed Analysis
1. **Gamma Original** (blue points):
- **c = -10.46**: Strong negative slope
- Data points: Widely scattered, with higher accuracy at lower L2 distances
- Trend: Negative correlation between L2 distance and accuracy
2. **Gamma Oracle** (orange points):
- **c = 0.58**: Weak positive slope
- Data points: Clustered around the dashed line, moderate spread
- Trend: Slight positive correlation, but low variability
3. **Gamma Bayesian** (orange points):
- **c = 1.48**: Strong positive slope
- Data points: Dense cluster near the dashed line, minimal spread
- Trend: Strong positive correlation, consistent performance
4. **Bayesian Assistant** (beige points):
- **c = 1.01**: Moderate positive slope
- Data points: Moderate spread, some outliers above the dashed line
- Trend: Positive correlation with slight variability
### Key Observations
- **Negative Correlation**: Gamma Original shows a strong inverse relationship (c = -10.46), suggesting accuracy decreases as L2 distance increases.
- **Positive Correlations**: All other plots exhibit positive relationships, with Gamma Bayesian having the strongest (c = 1.48).
- **Data Density**: Gamma Bayesian has the tightest clustering, indicating consistent model behavior. Gamma Original has the most dispersed data.
- **Outliers**: Bayesian Assistant shows a few points above the dashed line, suggesting occasional overperformance.
### Interpretation
The "c" values likely represent regression coefficients or model-specific parameters. Gamma Original's negative c implies a detrimental effect of prior mean distance on accuracy, while positive c values in other plots suggest beneficial relationships. The Bayesian models (Oracle and Bayesian) demonstrate higher c values, indicating better alignment between prior mean distance and accuracy. The Gamma Bayesian plot's tight clustering suggests optimal model calibration, whereas Gamma Original's dispersion may indicate overfitting or poor prior selection. The Bayesian Assistant's moderate c and spread reflect a balance between prior influence and adaptability.