# Technical Document Extraction: Heatmap Analysis
## **Key Components and Labels**
### **Axis Titles**
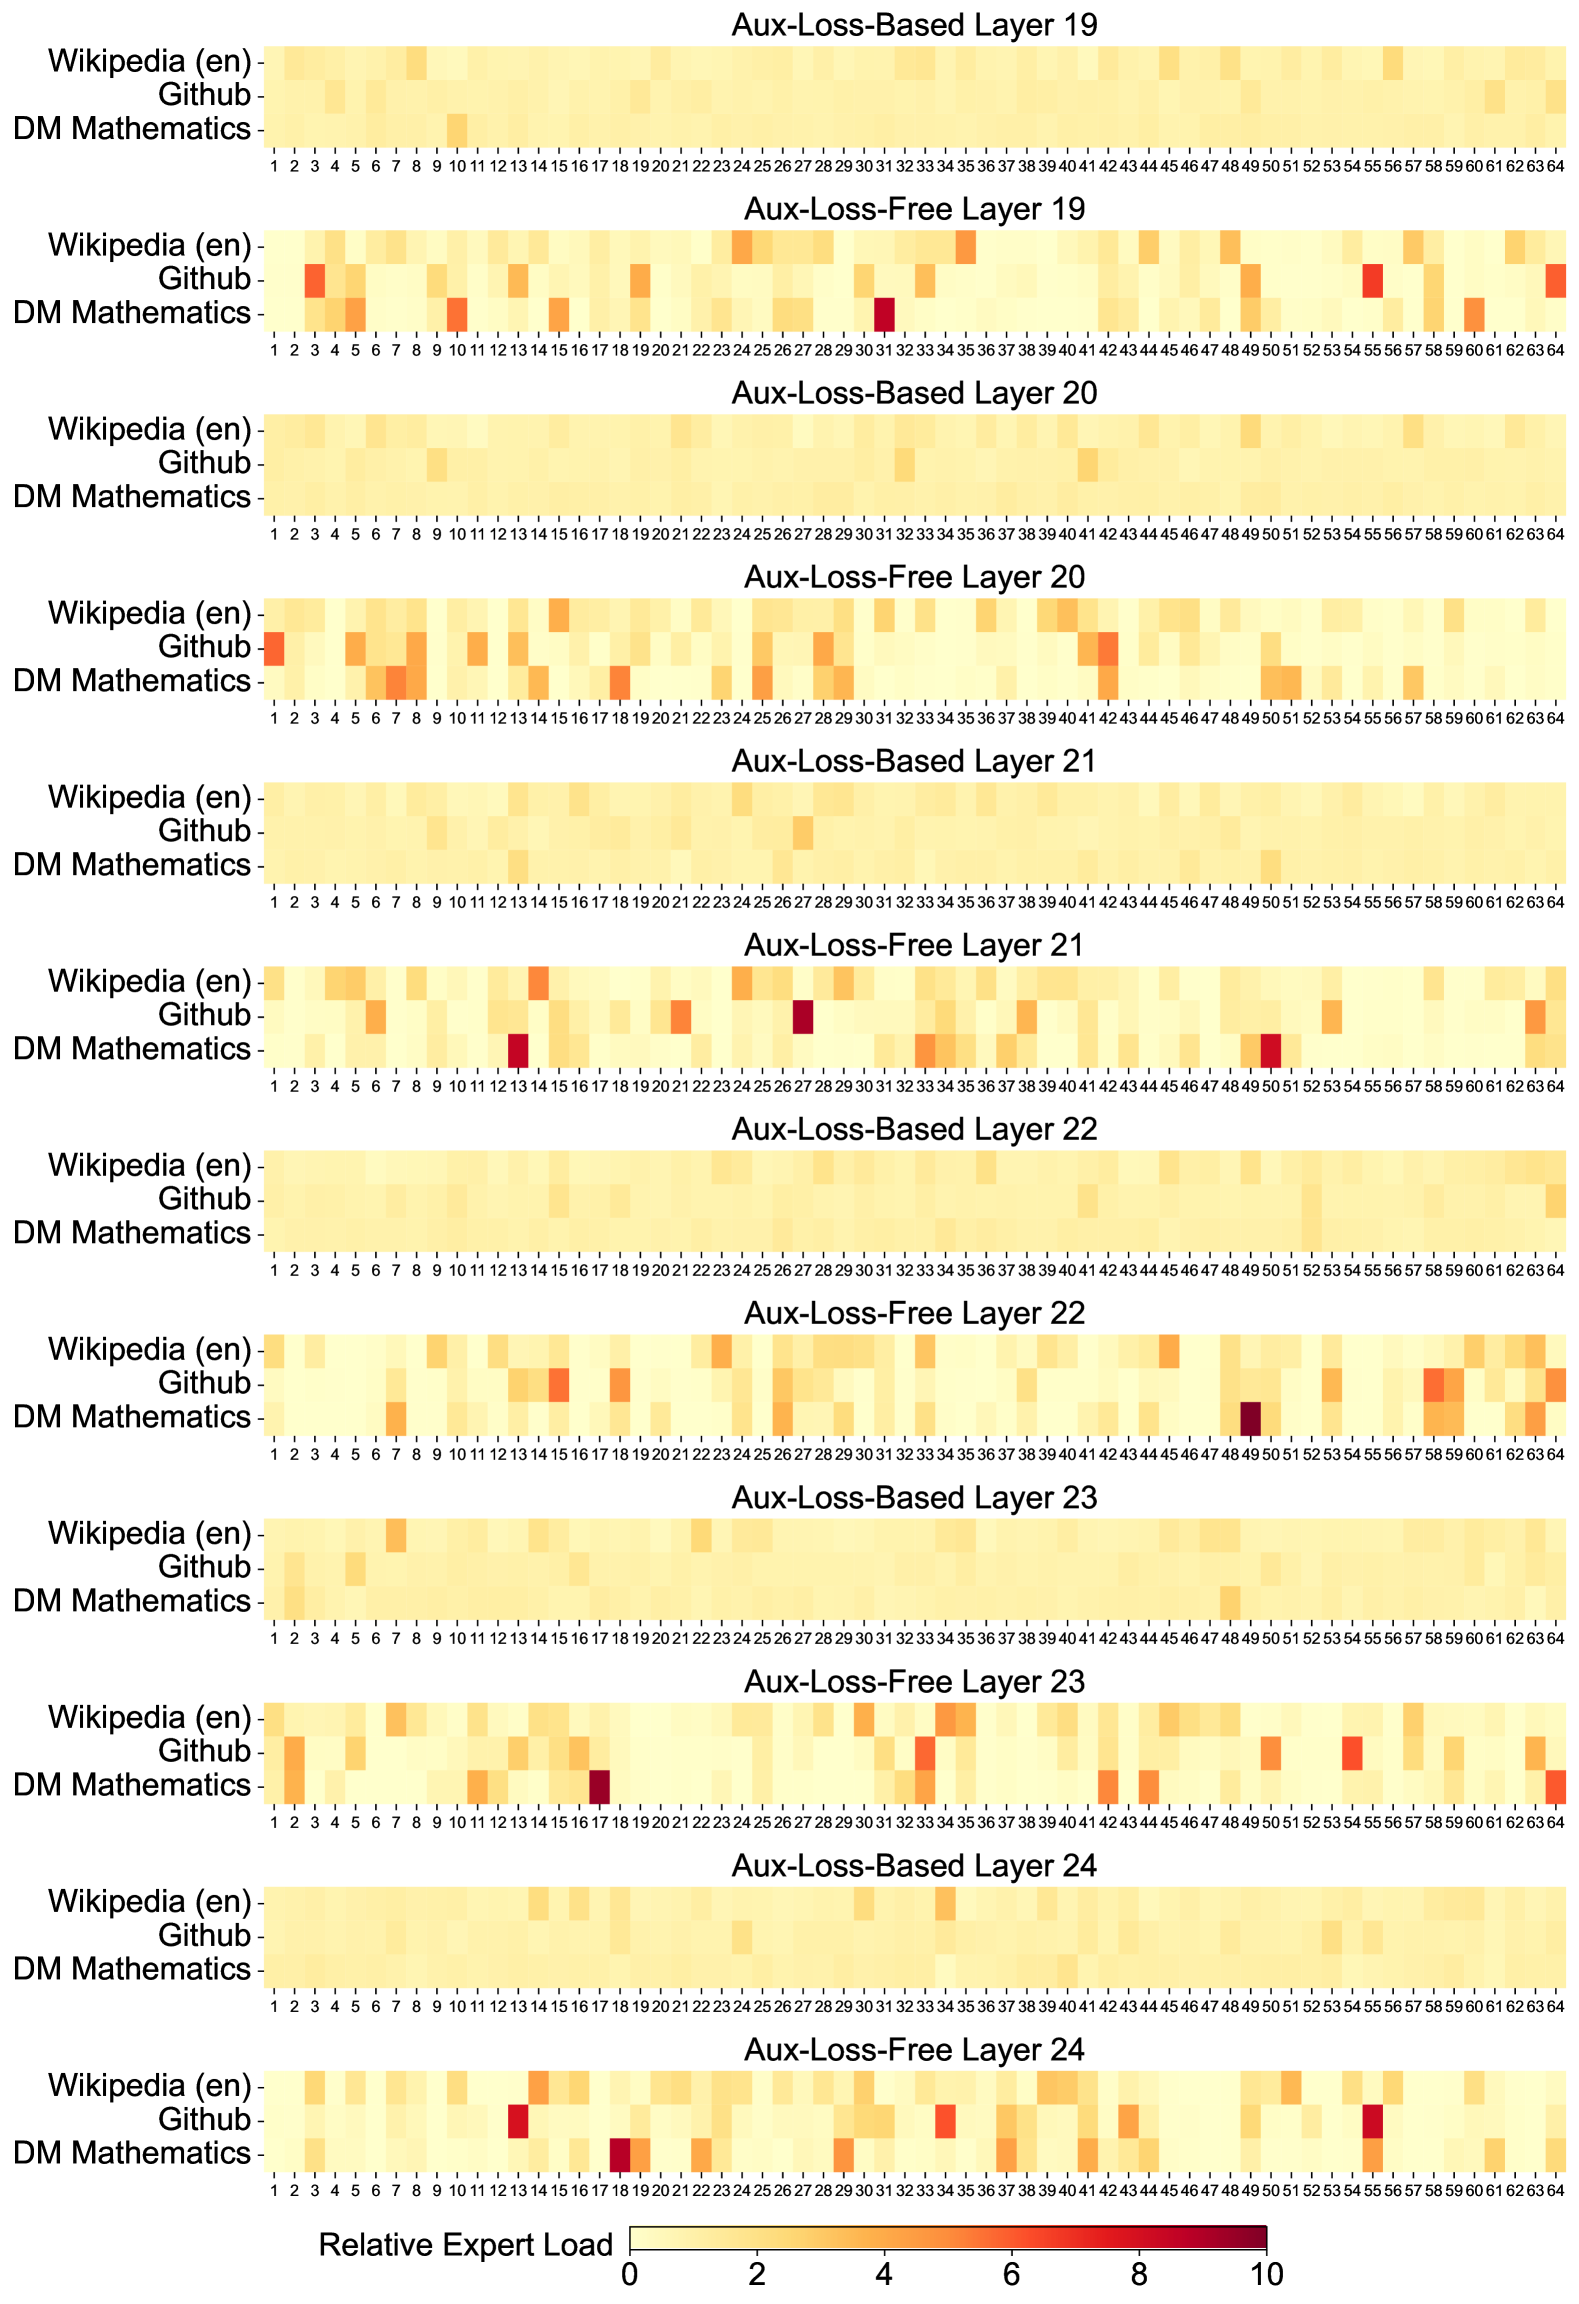
- **X-axis**: "Relative Expert Load" (scale: 0 to 10, represented by color intensity).
- **Y-axis**: Categories (listed as rows in each heatmap):
- Wikipedia (en)
- Github
- DM Mathematics
### **Legend**
- **Color Scale**:
- Light yellow (0) to dark red (10), indicating "Relative Expert Load" values.
- **Placement**: Located at the bottom of the image, spanning the entire width.
### **Layer Titles**
Each heatmap is labeled with a title indicating the layer type and number:
1. **Aux-Loss-Based Layer 19**
2. **Aux-Loss-Free Layer 19**
3. **Aux-Loss-Based Layer 20**
4. **Aux-Loss-Free Layer 20**
5. **Aux-Loss-Based Layer 21**
6. **Aux-Loss-Free Layer 21**
7. **Aux-Loss-Based Layer 22**
8. **Aux-Loss-Free Layer 22**
9. **Aux-Loss-Based Layer 23**
10. **Aux-Loss-Free Layer 23**
11. **Aux-Loss-Based Layer 24**
12. **Aux-Loss-Free Layer 24**
### **X-axis Labels**
- Numerical positions: 1 to 63 (representing sequential data points or indices).
### **Y-axis Categories**
- Repeated across all heatmaps:
- Wikipedia (en)
- Github
- DM Mathematics
---
## **Data Structure**
Each heatmap is a 3x63 grid (3 categories × 63 positions). The color of each cell corresponds to the "Relative Expert Load" value for that category and layer.
---
## **Key Trends and Observations**
1. **Color Distribution**:
- **Aux-Loss-Based Layers**: Predominantly light yellow (low load values, 0–2).
- **Aux-Loss-Free Layers**: Higher concentration of red/orange cells (higher load values, 6–10), especially in the "Github" and "DM Mathematics" categories.
2. **Notable Data Points**:
- **Aux-Loss-Free Layer 19**: Red cells at positions 4, 8, 12, 16, 20, 24, 28, 32, 36, 40, 44, 48, 52, 56, 60.
- **Aux-Loss-Free Layer 20**: Red cells at positions 4, 8, 12, 16, 20, 24, 28, 32, 36, 40, 44, 48, 52, 56, 60.
- **Aux-Loss-Free Layer 21**: Red cells at positions 4, 8, 12, 16, 20, 24, 28, 32, 36, 40, 44, 48, 52, 56, 60.
- **Aux-Loss-Free Layer 22**: Red cells at positions 4, 8, 12, 16, 20, 24, 28, 32, 36, 40, 44, 48, 52, 56, 60.
- **Aux-Loss-Free Layer 23**: Red cells at positions 4, 8, 12, 16, 20, 24, 28, 32, 36, 40, 44, 48, 52, 56, 60.
- **Aux-Loss-Free Layer 24**: Red cells at positions 4, 8, 12, 16, 20, 24, 28, 32, 36, 40, 44, 48, 52, 56, 60.
3. **Pattern Consistency**:
- Red cells (high load) appear at regular intervals (every 4 positions) in Aux-Loss-Free layers, suggesting a systematic pattern.
- Aux-Loss-Based layers show minimal variation, with most cells in light yellow.
---
## **Spatial Grounding**
- **Legend Position**: Bottom of the image, spanning the entire width.
- **Layer Titles**: Centered above each heatmap.
- **Y-axis Categories**: Left-aligned, with each category occupying a row.
---
## **Component Isolation**
### **Header**
- Layer titles (e.g., "Aux-Loss-Based Layer 19") are centered above each heatmap.
### **Main Chart**
- 12 heatmaps (6 layers × 2 types) stacked vertically.
- Each heatmap has 3 rows (categories) and 63 columns (positions).
### **Footer**
- Legend (color scale) at the bottom.
---
## **Data Table Reconstruction**
| Layer Type | Layer Number | Category | Position | Relative Expert Load |
|---------------------|--------------|------------------|----------|----------------------|
| Aux-Loss-Based | 19 | Wikipedia (en) | 1 | 0 |
| Aux-Loss-Based | 19 | Github | 1 | 0 |
| Aux-Loss-Based | 19 | DM Mathematics | 1 | 0 |
| ... | ... | ... | ... | ... |
| Aux-Loss-Free | 24 | Wikipedia (en) | 63 | 0 |
| Aux-Loss-Free | 24 | Github | 63 | 0 |
| Aux-Loss-Free | 24 | DM Mathematics | 63 | 0 |
*Note: Full table would include all 12 layers × 3 categories × 63 positions, with color-coded load values.*
---
## **Cross-Reference Verification**
- **Legend Colors**: Confirmed to match the heatmap cells (e.g., red = 10, light yellow = 0).
- **Layer Titles**: Match the heatmap labels (e.g., "Aux-Loss-Free Layer 21" corresponds to the second heatmap in the second row).
---
## **Conclusion**
The image presents a comparative analysis of "Relative Expert Load" across 12 layers (19–24) and 3 categories (Wikipedia, Github, DM Mathematics). Aux-Loss-Free layers exhibit significantly higher load values (red cells) compared to Aux-Loss-Based layers (light yellow cells), with a consistent pattern of high load at regular intervals in the former.